If it's in the News, it's in our Polls. Public opinion polling since 2003.

Public Content

Most Recent Releases

February 3, 2015

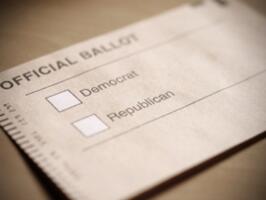
Voters Want Spending Cuts With No Sacred Cows Protected

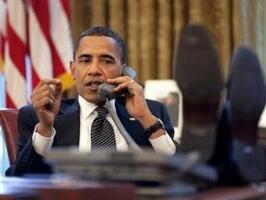
President Obama has proposed a near $4 trillion budget to Congress that includes spending and tax  increases. However, most voters still want federal spending cuts across the board but think it’s unlikely cuts will actually happen.

A new Rasmussen Reports national telephone survey finds that 54% of Likely U.S. Voters think thoughtful spending cuts should be considered in every program of the federal government. This finding is consistent with surveying over the past year but remains below the high of 63% found in October 2013. Twenty-eight percent (28%) disagree, while 18% are not sure. (To see survey question wording, click here.)

(Want a free daily e-mail update? If it's in the news, it's in our polls).   Rasmussen Reports updates are also available on Twitter or Facebook.

The survey of 800 Likely Voters was conducted on January 27-28, 2015 by Rasmussen Reports. The margin of sampling error is +/- 3.5 percentage points with a 95% level of confidence. Field work for all Rasmussen Reports surveys is conducted by Pulse Opinion Research, LLC. See methodology.

February 2, 2015

Generic Congressional Ballot: Democrats 40%, Republicans 38%

Democrats have a two-point lead over Republicans on the latest Generic Congressional Ballot. 

A new Rasmussen Reports national telephone survey for the week ending February 1 finds that 40% of Likely U.S. Voters would vote for the Democratic candidate in their district's congressional race if the election were held today, while 38% would choose the Republican instead.

(Want a free daily e-mail update? If it's in the news, it's in our polls). Rasmussen Reports updates are also available on Twitter or Facebook

The national telephone survey of 2,800 Likely Voters was conducted by Rasmussen Reports from January 26-February 1, 2015. The margin of sampling error for the survey is +/- 2 percentage points with a 95% level of confidence. Field work for all Rasmussen Reports surveys is conducted by Pulse Opinion Research, LLC. See methodology.

February 2, 2015

Obama’s Full-Month Approval Up Another Point in January

When tracking President Obama’s job approval on a daily basis, people sometimes get so caught up in the day-to-day fluctuations that they miss the bigger picture. To look at the longer-term trends, Rasmussen Reports compiles the numbers on a full-month basis, and the results can be seen in the graphics below.  

The president earned a monthly job approval of 49% in January. That’s up a point from December and up two points from the three months prior. It also ties Obama’s high for 2014 reached in February and May. His monthly approval hit a two-year low of 45% in November 2013 during the troubled rollout of the new national health care law.

(Want a free daily e-mail update? If it's in the news, it's in our polls). Rasmussen Reports updates are also available on Twitter or Facebook.

Daily tracking results are collected via telephone surveys of 400 likely voters per night. The monthly numbers in this article are based on approximately 12,000 interviews each month with likely voters. The margin of sampling error is less than +/- 1 percentage points with a 95% level of confidence.

February 2, 2015

Voters Prefer Federal Budget With Spending Cuts, No New Taxes

President Obama is expected to propose a near $4 trillion federal budget today that includes tax and spending increases, but most voters still prefer to cut spending and don’t see a need for higher taxes.

Just 16% of Likely U.S. Voters favor a federal budget that increases spending, according to a new Rasmussen Reports national telephone survey. Fifty-four percent (54%) like a budget that cuts spending, while 21% think spending levels should remain about the same. (To see survey question wording, click here.)

(Want a free daily e-mail update? If it's in the news, it's in our polls).  Rasmussen Reports updates are also available on Twitter or Facebook.

The survey of 800 Likely Voters was conducted on January 31-February 1, 2015 by Rasmussen Reports. The margin of sampling error is +/- 3.5 percentage points with a 95% level of confidence. Field work for all Rasmussen Reports surveys is conducted by Pulse Opinion Research, LLC. See methodology.

February 2, 2015

Voters Are Less Supportive of Government-Imposed Levels of Health Insurance

Voters are more critical of the health care they personally receive but still don’t expect it to get better under Obamacare. Most think consumers are better off with less government involvement in the health care marketplace.

The latest Rasmussen Reports national telephone survey finds that just 33% of Likely U.S. Voters rate the U.S. health care system in general as good or excellent. Twenty-eight percent (28%) regard the system as poor. This is consistent with voter attitudes since mid-2013. (To see survey question wording, click here.)

(Want a free daily e-mail update? If it's in the news, it's in our polls).  Rasmussen Reports updates are also available on Twitter or Facebook.

The survey of 800 Likely Voters was conducted on January 31-February 1, 2015 by Rasmussen Reports. The margin of sampling error is +/- 3.5 percentage points with a 95% level of confidence. Field work for all Rasmussen Reports surveys is conducted by Pulse Opinion Research, LLC. See methodology.

February 1, 2015

Super Bowl Viewers Predict The Winner

Now that we’ve spent two weeks discussing deflated footballs, there’s a game to be played today between the New England Patriots and Seattle Seahawks, and Super Bowl viewers have a clear favorite.

Forty-nine percent (49%) of American Adults who plan to watch Super Bowl XLIX think Seattle will win, while 35% pick New England to emerge victorious. A new Rasmussen Reports national telephone survey finds that 16% are still undecided. (To see survey question wording, click here.)

(Want a free daily e-mail update? If it's in the news, it's in our polls).    Rasmussen Reports updates are also available on Twitter or Facebook

The survey of 558 Adults Planning to Watch the Super Bowl was conducted on January 28-29, 2015 by Rasmussen Reports. The margin of sampling error is +/- 4 percentage points with a 95% level of confidence. Field work for all Rasmussen Reports surveys is conducted by Pulse Opinion Research, LLC. See methodology.

January 31, 2015

What They Told Us: Reviewing Last Week’s Key Polls - Week Ending January 31, 2015

A more optimistic America plans to take a Super Bowl break tomorrow, but why isn’t President Obama getting more credit for our improving national disposition?

January 30, 2015

Most Eat Fast Food For Convenience

Half of Americans say they rarely eat fast food, but for those who do, it’s not necessarily because they like it.

A new Rasmussen Reports national telephone survey finds that 48% of American Adults eat fast food at least once a week, with 14% who eat it two or more times weekly. Fifty percent (50%) say they never touch the stuff, although that’s down from 56% in July 2013.  (To see survey question wording, click here.)

(Want a free daily e-mail update? If it's in the news, it's in our polls). Rasmussen Reports updates are also available on Twitter or Facebook.

The survey of 800 American Adults was conducted on January 22-23, 2015 by Rasmussen Reports. The margin of sampling error is +/- 3.5 percentage points with a 95% level of confidence. Field work for all Rasmussen Reports surveys is conducted by Pulse Opinion Research, LLC. See methodology.

January 30, 2015

GOP Voters Agree With Romney on Need for A New Face

Republican voters agree with Mitt Romney that their party should look for someone new to run in 2016.

In announcing his decision today not to seek the Republican presidential nomination in 2016, Romney said:  “I believe that one of our next generation of Republican leaders, one who may not be as well known as I am today, one who has not yet taken their message across the country, one who is just getting started, may well emerge as being better able to defeat the Democrat nominee. In fact, I expect and hope that to be the case.”

January 30, 2015

Katy Perry, Ads Are Big Draws for Many Super Bowl Fans

While the Super Bowl may be the biggest sporting event of the year, a sizable number of viewers are more attracted to the big budget commercials and the halftime show by pop star Katy Perry.

A new Rasmussen Reports national telephone survey finds that 38% of Americans who plan to watch the Super Bowl think the commercials are more interesting than the game itself. This is up four points from last year. Half (51%) of viewers find the game itself to be more interesting, but this finding has been trending downwards since 2011 when 58% felt that way. Eleven percent (11%) are undecided. (To see survey question wording, click here.)

(Want a free daily e-mail update? If it's in the news, it's in our polls).  Rasmussen Reports updates are also available on Twitter or Facebook.

The survey of 558 Adults Planning to Watch the Super Bowl was conducted on January 28-29, 2015 by Rasmussen Reports. The margin of sampling error is +/- 4 percentage points with a 95% level of confidence. Field work for all Rasmussen Reports surveys is conducted by Pulse Opinion Research, LLC. See methodology.

January 30, 2015

How Do Americans Feel About Women, Gays in the Pulpit?

Americans support women in the pulpit and in senior leadership positions within the church. But they are more hesitant when it comes to supporting openly gay and lesbian religious leaders.

A new Rasmussen Reports national telephone survey finds that 60% of American Adults favor women in the pulpit, while just 16% are opposed. Twenty-five percent (25%) are undecided. (To see survey question wording, click here.)

(Want a free daily e-mail update? If it's in the news, it's in our polls). Rasmussen Reports updates are also available on Twitter or Facebook

The national survey of 800 Adults was conducted on January 26-27, 2015 by Rasmussen Reports. The margin of sampling error is +/- 3.5 percentage points with a 95% level of confidence. Field work for all Rasmussen Reports surveys is conducted by Pulse Opinion Research, LLC. See methodology.

White letter R on blue background
January 30, 2015

My Mistakes About 2016 Presidential Race by Michael Barone

Some columnists write New Year's columns chronicling the mistakes over the last year. I don't, but as this January has rolled on, it's become clear I've made many about the 2016 presidential race.

January 30, 2015

Voters Think Obama Getting Tougher With His Opponents

While voters are more confident in the economy and the direction of the country, attitudes about the quality of President Obama's leadership remain basically unchanged. Voters do recognize, though, that the president is getting more confrontational with his political opponents.

A new Rasmussen Reports national telephone survey finds that 43% of Likely U.S. Voters think the president is doing a good or excellent job. This is up five points from the three-year low found in November, but his positives have generally run in the mid-40s in monthly surveys since he took office. Forty-one percent (41%) now say the president is doing a poor job, in line with findings for the past three years. (To see survey question wording, click here).

(Want a free daily e-mail update? If it's in the news, it's in our polls). Rasmussen Reports updates are also available on Twitter or Facebook.

The survey of 800 Likely Voters was conducted on January 27-28, 2014 by Rasmussen Reports. The margin of sampling error is +/- 3.5 percentage points with a 95% level of confidence. Field work for all Rasmussen Reports surveys is conducted by Pulse Opinion Research, LLC. See methodology.

January 29, 2015

Americans Still Prefer Eating at Home

Americans are eating out more but still enjoying it less than a good meal at home.

A new Rasmussen Reports national telephone survey finds that 36% of American Adults rarely or never go out to a restaurant for dinner, but that’s down from 41% two years ago and a high of 47% in July 2012. Sixty-one percent (61%) say they eat out at least once a week, with 20% who do so two or more times weekly. (To see survey question wording, click here.)

(Want a free daily e-mail update? If it's in the news, it's in our polls). Rasmussen Reports updates are also available on Twitter or Facebook.

The survey of 800 American Adults was conducted on January 22-23, 2015 by Rasmussen Reports. The margin of sampling error is +/- 3.5 percentage points with a 95% level of confidence. Field work for all Rasmussen Reports surveys is conducted by Pulse Opinion Research, LLC. See methodology.

January 29, 2015

Do Democratic Voters Like Their Party Leaders?

Democratic voters have their complaints with Washington, D.C., but they remain more content with their party’s political representation than Republican voters are.

Here are some findings from a new Rasmussen Reports national telephone survey of Likely Democratic Voters:

-- Forty-six percent (46%) believe Democrats in Congress have done a good job representing Democratic values over the past several years. By comparison, just 24% of Republican voters think their representatives have done a good job upholding party values. But now 42% of Democrats think their legislators have lost touch with Democratic voters throughout the nation, up from 33% last September. (To see survey question wording, click here.)

(Want a free daily e-mail update? If it's in the news, it's in our polls). Rasmussen Reports updates are also available on Twitter or Facebook.

The survey of 648 Likely Democratic Voters was conducted on January 18-19, 2015 by Rasmussen Reports. The margin of sampling error is +/- 4 percentage points with a 95% level of confidence. Field work for all Rasmussen Reports surveys is conducted by Pulse Opinion Research, LLC. See methodology.

January 29, 2015

Voters Don’t Want Next Attorney General To Be Like Holder

Loretta Lynch is soon likely to be the most powerful cop in America, and a big chunk of voters don’t even know who she is. But one thing they do know: They don’t want her to be like Eric Holder, the current U.S. attorney general.

The latest Rasmussen Reports national telephone survey finds that 33% of Likely U.S. Voters have a favorable opinion of the federal prosecutor from Brooklyn, N.Y., whom President Obama has nominated to be the next attorney general. Twenty-nine percent (29%) view her unfavorably. This includes 11% with a Very Favorable opinion and 12% with a Very Unfavorable one. But 38% don’t know enough about her to voice any kind of opinion. (To see survey question wording, click here.)

(Want a free daily e-mail update? If it's in the news, it's in our polls).  Rasmussen Reports updates are also available on Twitter or Facebook.

The survey of 800 Likely Voters was conducted on January 27-28, 2015 by Rasmussen Reports. The margin of sampling error is +/- 3.5 percentage points with a 95% level of confidence. Field work for all Rasmussen Reports surveys is conducted by Pulse Opinion Research, LLC. See methodology.

White letter R on blue background
January 29, 2015

The Internet of Every Damn Thing By Froma Harrop

Federal Trade Commission head Edith Ramirez put the matter plainly: "If I'm wearing a fitness band that tracks how many calories I consume, I wouldn't want to share that data with an insurance company." 

White letter R on blue background
January 29, 2015

For Republicans, a 2016 Tie Is a Win By Kyle Kondik

Republican National Committee Chairman Reince Priebus, elected to a third term earlier this month, often notes that the presidential cycle is harder for his party than midterms because the electorate is more diverse and Democratic. “For us to win a presidential election, we have to be just about perfect, and the Democrats have to be good,” he told Kyle Cheney of Politico.

January 28, 2015

Voters More Skeptical Of Right-To-Work Laws

As Kentucky, Illinois and several other states consider adopting right-to-work laws, voters aren’t as convinced that such laws which ban compulsory union dues have a positive impact on state economies. However, those who currently live in right-to-work states paint a rosier picture.

A new Rasmussen Reports national telephone survey finds that 35% of Likely U.S. Voters believe right-to-work laws are good for a state’s economy. That’s down 10 points from December 2012. But 26% now say such laws are bad for a state’s economy, up from 22% two years ago. Eleven percent (11%) think right-to-work laws have no impact, while a sizable 28% are not sure. (To see survey question wording, click here.)

(Want a free daily e-mail update? If it's in the news, it's in our polls). Rasmussen Reports updates are also available on Twitter or Facebook.

The survey of 800 Likely Voters was conducted on January 25-26, 2015 by Rasmussen Reports. The margin of sampling error is +/- 3.5 percentage points with a 95% level of confidence. Field work for all Rasmussen Reports surveys is conducted by Pulse Opinion Research, LLC. See methodology.

January 28, 2015

35% Say U.S. Heading in Right Direction

Thirty-five percent (35%) of Likely U.S. Voters think the country is heading in the right direction, according to a new Rasmussen Reports national telephone survey for the week ending January 25. 

This finding is up five points from the week before and is the highest level of confidence since March 2013. The number of voters who think the country is heading in the right direction was below 30% most weeks for the past year.

(Want a free daily e-mail update? If it's in the news, it's in our polls). Rasmussen Reports updates are also available on Twitter or Facebook.

The national telephone survey of 2,800 Likely Voters was conducted by Rasmussen Reports from January 19-25, 2015. The margin of sampling error for the survey is +/- 2 percentage points with a 95% level of confidence. Field work for all Rasmussen Reports surveys is conducted by Pulse Opinion Research, LLC. See methodology.