If it's in the News, it's in our Polls. Public opinion polling since 2003.

Politics

Most Recent Releases

November 27, 2013

41% Favor Nuclear Deal with Iran, 43% Oppose

Voters are almost evenly divided over a treaty the United States has reached with Iran to slow that country’s nuclear weapons program and tend to think the arrangement is likely to make things worse in the Middle East.

The latest Rasmussen Reports national telephone survey finds that 41% favor the short-term deal that ends some economic sanctions on Iran in exchange for verifiable cutbacks in the Iranian nuclear weapons program. Forty-three percent (43%) oppose that deal. Sixteen percent (16%) are undecided. (To see survey question wording,click here.)

(Want a free daily e-mail update? If it's in the news, it's in our polls). Rasmussen Reports updates are also available on Twitter or Facebook.

The survey of 1,000 Likely Voters was conducted on November 25-26, 2013 by Rasmussen Reports. The margin of sampling error is +/- 3 percentage points with a 95% level of confidence. Field work for all Rasmussen Reports surveys is conducted by Pulse Opinion Research, LLC. See methodology.

November 26, 2013

47% Think It’s Negative To Compare A Candidate to Obama or George W. Bush

Comparing a candidate to President Obama is as bad these days as comparing one to George W. Bush as far as voters are concerned. For most voters, Ronald Reagan remains the best president of the last 30 years to compare a politician to.

A new Rasmussen Reports national telephone survey finds that 47% of Likely U.S. Voters consider it a negative to describe a candidate as being like Barack Obama. Just as many (48%) view a comparison to Bush as a negative.

For 29%, comparing a political candidate to Obama is a positive, while 19% consider it somewhere in between a positive and a negative. Similarly, 24% say describing a candidate as being like his Republican predecessor in the White House is a positive, while 26% think it’s somewhere in between. (To see survey question wording, click here.)

(Want a free daily e-mail update? If it's in the news, it's in our polls). Rasmussen Reports updates are also available on Twitter or Facebook.

The survey of 1,000 Likely Voters was conducted on November 23-24, 2013 by Rasmussen Reports. The margin of sampling error is +/- 3 percentage points with a 95% level of confidence. Field work for all Rasmussen Reports surveys is conducted by Pulse Opinion Research, LLC. See methodology.

November 25, 2013

Obama Approval: Comparing the Numbers

So how does America view President Obama these days? It depends on how you ask the question and whom you ask.

Rasmussen Reports in our daily Presidential Tracking Poll gives respondents four options – Strongly Approve, Somewhat Approve, Somewhat Disapprove and Strongly Disapprove - as opposed to just two - Approve/Disapprove. We are also the one major national pollster who asks this question only of likely U.S. voters, those who tell us they are likely to vote in the next election.

November 25, 2013

51% Want All U.S. Troops Out of Afghanistan Next Year

The United States has proposed a security deal to Afghanistan that would leave some U.S. troops in that country after next year, but just over half of U.S. voters want all troops out of Afghanistan by then. 

A new Rasmussen Reports national telephone survey finds that 51% of Likely U.S. Voters believe the United States should withdraw all troops from Afghanistan by 2014 and leave Afghan troops to fight the Taliban on their own. Thirty-eight percent (38%) would rather some U.S. troops remain in the country after next year. Ten percent (10%) are undecided. (To see survey question wording, click here.)

(Want a free daily e-mail update? If it's in the news, it's in our polls). Rasmussen Reports updates are also available on Twitter or Facebook.

The survey of 1,000 Likely Voters was conducted on November 21-22, 2013 by Rasmussen Reports. The margin of sampling error is +/- 3 percentage points with a 95% level of confidence. Field work for all Rasmussen Reports surveys is conducted by Pulse Opinion Research, LLC. See methodology. 
spirit of america / Shutterstock.com
November 22, 2013

55% Say Senate Should Allow Yes-or-No Vote on All Presidential Nominees

The U.S. Senate yesterday ended rules that allowed a minority of senators to prevent a vote on a president’s political nominees, and most voters think the change is a good one.

Fifty-five percent (55%) of Likely U.S. Voters think that, regardless of any disagreements, every presidential nominee should be the subject of a simple yes-or-no vote in the Senate. A new Rasmussen Reports national telephone survey finds that just 23% disagree, but another 23% are not sure. (To see survey question wording, click here.)

(Want a free daily e-mail update? If it's in the news, it's in our polls). Rasmussen Reports updates are also available on Twitter or Facebook.

The survey of 1,000 Likely Voters was conducted on November 19-20, 2013 by Rasmussen Reports. The margin of sampling error is +/- 3 percentage points with a 95% level of confidence. Field work for all Rasmussen Reports surveys is conducted by Pulse Opinion Research, LLC. See methodology. 

ChameleonsEye / Shutterstock.com
November 21, 2013

24% Believe Obama Opponents Driven By Racism

With President Obama struggling through perhaps the lowest point of his presidency, one-in-four voters believes racism is the driving factor behind opposition to his policies. But similar to past polls, voters of different races strongly disagree.

Sixty percent (60%) of Likely U.S. Voters think people oppose the president’s policies primarily because they believe the policies are bad. A new Rasmussen Reports telephone survey finds that 24% believe the opposition is due to racism. Ten percent (10%) think people oppose Obama’s policies for some other reason. (To see survey question wording, click here.)

(Want a free daily e-mail update? If it's in the news, it's in our polls). Rasmussen Reports updates are also available on Twitter or Facebook.

The survey of 1,000 Likely Voters was conducted on November 19-20, 2013 by Rasmussen Reports. The margin of sampling error is +/- 3 percentage points with a 95% level of confidence. Field work for all Rasmussen Reports surveys is conducted by Pulse Opinion Research, LLC. See methodology. 

November 21, 2013

Lone Gunman or Conspiracy? Americans Are Evenly Divided Over JFK Assassination

Fifty years after the gunshots that ended the life of John F. Kennedy, Americans are evenly divided over whether the 35th president of the United States was killed by one man or by a still-unidentified group of conspirators.

Thirty-six percent (36%) of American Adults believe Kennedy was the victim of a lone gunman on November 22, 1963. But a new Rasmussen Reports national telephone survey finds that just as many (37%) think he was the victim of a larger conspiracy. A sizable 27% are not sure, highlighting the questions that still surround the Kennedy assassination. (To see survey question wording, click here.)

(Want a free daily e-mail update ? If it's in the news, it's in our polls). Rasmussen Reports updates are also available on Twitter  or Facebook .

The national survey of 1,000 Adults was conducted on November 16-17, 2011 by Rasmussen Reports. The margin of sampling error is +/- 3 percentage points with a 95% level of confidence. Field work for all Rasmussen Reports surveys is conducted by Pulse Opinion Research, LLC . See methodology.

November 20, 2013

43% Trust GOP More on Health Care, 39% Democrats

Voters are expressing slightly more confidence in Republicans these days when it comes to health care.

A new Rasmussen Reports national telephone survey finds that 43% of Likely U.S. Voters now trust the GOP more to handle health care. Thirty-nine percent (39%) trust Democrats more. In September, the two were essentially tied, with Republicans posting a 43% to 42% lead. (To see survey question wording, click here.)

(Want a free daily e-mail update? If it's in the news, it's in our polls). Rasmussen Reports updates are also available on Twitter or Facebook.

The survey of 1,000 Likely Voters was conducted on November 17-18, 2013 by Rasmussen Reports. The margin of sampling error is +/- 3 percentage points with a 95% level of confidence. Field work for all Rasmussen Reports surveys is conducted by Pulse Opinion Research, LLC. See methodology.

November 19, 2013

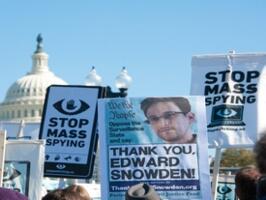
Voters Strongly Defend Their Basic Freedoms But See Government As A Threat

Voters continue to adamantly defend their constitutional freedoms, and most still consider the federal government a threat to those rights.

Just 30% of Likely U.S. Voters view the government today as a protector of individual rights, according to a new Rasmussen Reports national telephone survey. Fifty-five percent (55%) think the government is a threat to their rights. Fifteen percent (15%) are not sure. (To see survey question wording, click here.)

(Want a free daily e-mail update? If it's in the news, it's in our polls). Rasmussen Reports updates are also available on Twitter or Facebook.

The survey of 1,000 Likely Voters was conducted on November 17-18, 2013 by Rasmussen Reports. The margin of sampling error is +/- 3 percentage points with a 95% level of confidence. Field work for all Rasmussen Reports surveys is conducted by Pulse Opinion Research, LLC. See methodology.

November 18, 2013

78% Think U.S. Spies On Others As Much or More Than They Spy on Us

Most voters consider foreign spying a serious threat to the United States, but three-out-of-four think America spies on other countries as much or more than they spy on us.

Sixty-seven percent (67%) of Likely U.S. Voters believe spying on the United States by other countries is at least a somewhat serious threat, with 26% who say it’s Very Serious. A new Rasmussen Reports national telephone survey finds that 25% think foreign spying is not a serious threat, but that includes only three percent (3%) who feel it’s Not At All Serious. (To see survey question wording, click here.)

(Want a free daily e-mail update? If it's in the news, it's in our polls). Rasmussen Reports updates are also available on Twitter or Facebook.

The survey of 1,000 Likely Voters was conducted on November 15-16, 2013 by Rasmussen Reports. The margin of sampling error is +/- 3 percentage points with a 95% level of confidence. Field work for all Rasmussen Reports surveys is conducted by Pulse Opinion Research, LLC. See methodology.

November 15, 2013

62% Consider Clinton Better President Than Obama

Voters still strongly believe Bill Clinton was a better president than Barack Obama.

The latest Rasmussen Reports national telephone survey finds that 62% of Likely U.S. Voters think Clinton was a better president. Just 20% believe Obama is doing a better job than Clinton did when he was president from 1993 to 2001. Eighteen percent (18%) are undecided. (To see survey question wording, click here.)

(Want a free daily e-mail update? If it's in the news, it's in our polls). Rasmussen Reports updates are also available on Twitter or Facebook.

The national telephone survey of 1,000 Likely Voters was conducted by Rasmussen Reports on November 13-14, 2013. The margin of sampling error for the survey is +/- 2 percentage points with a 95% level of confidence. Fieldwork for all Rasmussen Reports surveys is conducted by Pulse Opinion Research, LLC. See methodology.

November 14, 2013

2016? Clinton Still Far Ahead Among Democrats; Christie, Paul in Near Tie

Looking ahead to the 2016 presidential race, Hillary Clinton has extended her lead among Democrats, but frontrunner Chris Christie now runs nearly even with Senator Rand Paul among Republicans.

A new Rasmussen Reports national telephone survey finds that Clinton earns 70% support from Likely Democratic Voters when they are asked whom they would vote for if the 2016 Democratic presidential primary were held in their state today. That’s up from 63% support in early August. (To see survey question wording, click here.)

(Want a free daily e-mail update? If it's in the news, it's in our polls). Rasmussen Reports updates are also available on Twitter or Facebook.

The survey of 1,000 Likely Voters was conducted on November 7-8, 2013 by Rasmussen Reports. The margin of sampling error is +/- 3 percentage points with a 95% level of confidence. Field work for all Rasmussen Reports surveys is conducted by Pulse Opinion Research, LLC. See methodology.

November 13, 2013

37% Say U.S. Needs Israel’s Approval Before Making Nuclear Deal with Iran

Most U.S. voters favor the current negotiations with Iran that would reduce that country’s nuclear program in exchange for lifting some economic sanctions. Israel strongly opposes the proposed deal, but voters are closely divided on how important Israel's approval is to the U.S. diplomatic effort.

Though the latest negotiations collapsed over the weekend, 52% of Likely Voters still favor a U.S. deal with Iran if Iran’s cooperation can be verified. A new Rasmussen Reports national telephone survey finds that 29% oppose the deal that would lift some economic sanctions in exchange for reductions in Iran's nuclear program. Nineteen percent (19%) are undecided. (To see survey question wording, click here.)

(Want a free daily e-mail update? If it's in the news, it's in our polls). Rasmussen Reports updates are also available on Twitter or Facebook.

The survey of 1,000 Likely Voters was conducted on November 11-12, 2013 by Rasmussen Reports. The margin of sampling error is +/- 3 percentage points with a 95% level of confidence. Field work for all Rasmussen Reports surveys is conducted by Pulse Opinion Research, LLC. See methodology.

miker / Shutterstock.com
November 13, 2013

46% Think Obama Lied About Impact of Health Law, 45% Disagree

Voters are evenly divided when asked whether President Obama deliberately lied about the impact of the health care law before it was passed by Congress. But they strongly believe Americans should be able to keep their existing health insurance policies.

A new Rasmussen Reports national telephone survey finds that 46% of Likely U.S. Voters believe the president purposely misled Americans about the potential impact of the health care law. Forty-five percent (45%) disagree and think Obama honestly expected the law to work out the way he said it would. Ten percent (10%) are undecided. (To see survey question wording, click here.)

(Want a free daily e-mail update? If it's in the news, it's in our polls). Rasmussen Reports updates are also available on Twitter or Facebook.

The survey of 1,000 Likely Voters was conducted on November 9-10, 2013 by Rasmussen Reports. The margin of sampling error is +/- 3 percentage points with a 95% level of confidence. Field work for all Rasmussen Reports surveys is conducted by Pulse Opinion Research, LLC. See methodology. 

November 12, 2013

54% Believe Federal Government Encourages Illegal Immigration

Most voters still believe the federal government encourages people to enter the United States illegally.

A new Rasmussen Reports national telephone survey finds that 54% of Likely U.S. voters feel the policies and practices of the federal government encourage illegal immigration. Twenty-two percent (22%) disagree, but just as many (23%) are not sure.

November 12, 2013

55% Favor Repeal of Obamacare

Most voters view the new national health care law as bad for the country and want to repeal it.

A new Rasmussen Reports national telephone survey finds that just 35% of Likely U.S. Voters now believe the trouble-plagued health care law is good for America. Fifty-five percent (55%) consider it bad for the country. Only two percent (2%) think it will have no impact. (To see survey question wording, click here.)

(Want a free daily e-mail update? If it's in the news, it's in our polls). Rasmussen Reports updates are also available on Twitter or Facebook.

The survey of 1,000 Likely Voters was conducted on November 9-10, 2013 by Rasmussen Reports. The margin of sampling error is +/- 3 percentage points with a 95% level of confidence. Field work for all Rasmussen Reports surveys is conducted by Pulse Opinion Research, LLC. See methodology.

November 11, 2013

2016? Clinton 43%, Christie 41%

It’s a dead heat.

A new Rasmussen Reports national telephone survey finds that if the 2016 presidential election were held today, 43% of Likely U.S. Voters would choose Democrat and former secretary of State Hillary Clinton, while 41% would opt for Chris Christie, New Jersey’s Republican governor, instead. Nine percent (9%) like some other choice, and eight percent (8%) are undecided. (To see survey question wording,click here.)

(Want a free daily e-mail update? If it's in the news, it's in our polls). Rasmussen Reports updates are also available on Twitter or Facebook.

The survey of 1,000 Likely Voters was conducted on November 7-8, 2013 by Rasmussen Reports. The margin of sampling error is +/- 3 percentage points with a 95% level of confidence. Field work for all Rasmussen Reports surveys is conducted by Pulse Opinion Research, LLC. See methodology.

November 8, 2013

12% Are Very Confident They'll Get All Promised Medicare Benefits

Most voters still view Medicare favorably but don't expect to get all their benefits from the federal health insurance system for retirees.

A new Rasmussen Reports national telephone survey finds that 64% of Likely U.S. Voters have at least a somewhat favorable impression of the Medicare system, including 26% with a Very favorable impression. Just 26% view Medicare unfavorably, with 10% who share a Very Unfavorable opinion. This is the most favorable view of the system that voters have held in a year.  (To see survey question wording, click here.)

(Want a free daily e-mail update? If it's in the news, it's in our polls).  Rasmussen Reports updates are also available on Twitter or Facebook.

The national survey of 1,000 Likely Voters was conducted on November 5-6, 2013 by Rasmussen Reports. The margin of sampling error is +/- 3 percentage points with a 95% level of confidence. Field work for all Rasmussen Reports surveys is conducted by Pulse Opinion Research, LLC. See methodology.

November 8, 2013

56% Think Their Congressman Likely to Have Sold a Vote

Congress for sale? That's what most voters still think.

A new Rasmussen Reports national telephone survey finds that 61% of Likely U.S. Voters believe most members of Congress are willing to sell their vote for cash or campaign contributions. Just 13% disagree, and twice as many more (26%) aren't sure. (To see survey question wording, click here.) 

(Want a free daily e-mail update? If it's in the news, it's in our polls). Rasmussen Reports updates are also available on Twitter or Facebook.

The survey of 1,000 Likely Voters was conducted on November 3-4, 2013 by Rasmussen Reports. The margin of sampling error is +/- 3 percentage points with a 95% level of confidence. Field work for all Rasmussen Reports surveys is conducted by Pulse Opinion Research, LLC. See methodology.

Only eight percent (8%) of all voters believe most members of Congress almost always get reelected because they do a good job representing their constituents. Most (67%) say they usually get reelected because election rules are rigged to benefit incumbents. Seventy-five percent (75%) now say Congress is doing a poor job, the legislative branch's highest negative in more than seven years of regular tracking.

November 7, 2013

54% Favor Law Prohibiting Workplace Discrimination Against LGBT People

The U.S. Senate is expected to pass the Employment Non-Discrimination Act (ENDA), a bill prohibiting workplace discrimination on the basis of gender identity or sexual orientation, although a plurality of voters don't see such discrimination as a serious problem. Most voters nationwide support the law, but one-in-three think certain religious organizations should be exempt from it.

A new Rasmussen Reports national telephone survey shows that 54% of Likely U.S. Voters favor a law that outlaws discrimination in the workplace against transgender, gay, lesbian and bisexual people. Thirty percent (30%) oppose such a law, while 16% are undecided. (To see survey question wording, click here.)

(Want a free daily e-mail update ? If it's in the news, it's in our polls.) Rasmussen Reports updates are also available on Twitter  or Facebook.

The survey of 1,000 Likely Voters was conducted on November 5-6, 2012 by Rasmussen Reports. The margin of sampling error is +/- 3 percentage points with a 95% level of confidence. Field work for all Rasmussen Reports surveys is conducted by Pulse Opinion Research, LLC . See methodology.