If it's in the News, it's in our Polls. Public opinion polling since 2003.

Elections

Most Recent Releases

January 22, 2014

54% in Michigan Blame Detroit Bankruptcy on Bad Government

Most Michigan voters think bad government was the reason for Detroit’s bankruptcy, and half oppose a federal government bailout to ensure full funding of the pensions of retired Detroit employees.

A plurality (47%) of Likely Michigan Voters agrees with emergency financial manager Kevin Orr’s decision to have Detroit file for bankruptcy, according to a new Rasmussen Reports telephone survey. Thirty-three percent (33%) disagree with the bankruptcy decision. Twenty percent (20%) are undecided. (To see survey question wording, click here.)

(Want a free daily e-mail update? If it's in the news, it's in our polls). Rasmussen Reports updates are also available on Twitter or Facebook.

The survey of 500 Likely Voters in Michigan was conducted on January 14-15, 2014 by Rasmussen Reports. The margin of sampling error is +/- 4.5 percentage points with a 95% level of confidence. Field work for all Rasmussen Reports surveys is conducted by Pulse Opinion Research, LLC. See methodology.

November 14, 2013

2016? Clinton Still Far Ahead Among Democrats; Christie, Paul in Near Tie

Looking ahead to the 2016 presidential race, Hillary Clinton has extended her lead among Democrats, but frontrunner Chris Christie now runs nearly even with Senator Rand Paul among Republicans.

A new Rasmussen Reports national telephone survey finds that Clinton earns 70% support from Likely Democratic Voters when they are asked whom they would vote for if the 2016 Democratic presidential primary were held in their state today. That’s up from 63% support in early August. (To see survey question wording, click here.)

(Want a free daily e-mail update? If it's in the news, it's in our polls). Rasmussen Reports updates are also available on Twitter or Facebook.

The survey of 1,000 Likely Voters was conducted on November 7-8, 2013 by Rasmussen Reports. The margin of sampling error is +/- 3 percentage points with a 95% level of confidence. Field work for all Rasmussen Reports surveys is conducted by Pulse Opinion Research, LLC. See methodology.

November 11, 2013

2016? Clinton 43%, Christie 41%

It’s a dead heat.

A new Rasmussen Reports national telephone survey finds that if the 2016 presidential election were held today, 43% of Likely U.S. Voters would choose Democrat and former secretary of State Hillary Clinton, while 41% would opt for Chris Christie, New Jersey’s Republican governor, instead. Nine percent (9%) like some other choice, and eight percent (8%) are undecided. (To see survey question wording,click here.)

(Want a free daily e-mail update? If it's in the news, it's in our polls). Rasmussen Reports updates are also available on Twitter or Facebook.

The survey of 1,000 Likely Voters was conducted on November 7-8, 2013 by Rasmussen Reports. The margin of sampling error is +/- 3 percentage points with a 95% level of confidence. Field work for all Rasmussen Reports surveys is conducted by Pulse Opinion Research, LLC. See methodology.

October 30, 2013

Virginia Governor: McAuliffe (D) 43%, Cuccinelli (R) 36%, Sarvis (L) 12%

With less than a week to go until Election Day, Democrat Terry McAuliffe has a seven-point lead over Republican Ken Cuccinelli in Virginia’s gubernatorial race. The latest Rasmussen Reports telephone survey of Likely Voters in Virginia shows McAuliffe with 43% support to Cuccinelli’s 36%. Libertarian candidate Robert Sarvis draws his highest level of support yet with 12%. Two percent (2%) prefer some other candidate, and seven percent (7%) remain undecided. (To see survey question wording, click here.)

(Want a  free daily e-mail update ? If it's in the news, it's in our polls).   Rasmussen Reports updates are also available on Twitter or Facebook.

The survey of 1,002 Likely Voters in Virginia was conducted on October 28-29, 2013 by Rasmussen Reports. The margin of sampling error is +/- 3 percentage points with a 95% level of confidence. Fieldwork for all Rasmussen Reports surveys is conducted by Pulse Opinion Research, LLC. See methodology.

October 9, 2013

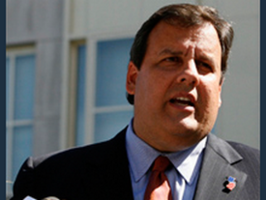
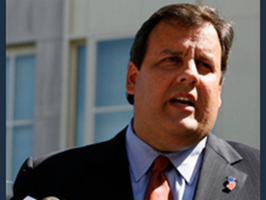
NJ Governor: Christie (R) 55%, Buono (D) 34%

New Jersey Governor Chris Christie continues to lead Democratic challenger Barbara Buono by over 20 points in his bid for reelection.

A new Rasmussen Reports statewide telephone survey conducted before last night’s gubernatorial debate shows Christie with 55% support from Likely New Jersey Voters to Buono’s 34%.  Four percent (4%) prefer some other candidate, and seven percent (7%) are undecided. (To see survey question wording, click here.)

Just Seven Days Left! Sign up for Rasmussen Reader subscription through December 31, 2014 for just $24.95. Offer expires October 16, 2013.

(Want a free daily e-mail update? If it's in the news, it's in our polls). Rasmussen Reports updates are also available on Twitter or Facebook.

The state survey of 1,000 Likely Voters in New Jersey was conducted October 7, 2013 by Rasmussen Reports. The margin of sampling error is +/- 3 percentage points with a 95% level of confidence. Field work for all Rasmussen Reports surveys is conducted by Pulse Opinion Research, LLC. See methodology.

October 8, 2013

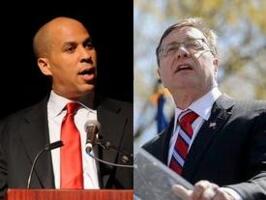
NJ Senate: Booker (D) 53%, Lonegan (R) 41%

The New Jersey special election for U.S. Senate is just over a week away, and Newark Mayor Cory Booker still holds a double-digit lead over Republican Steve Lonegan.

The latest Rasmussen Reports telephone survey of Likely New Jersey Voters shows Booker with 53% of the vote to Lonegan’s 41%. One percent (1%) prefer some other candidate, and five percent (5%) are undecided. (To see survey question wording, click here.) 

Special offer:  A Rasmussen Reader subscription that lasts through December 31, 2014 is now just $24.95. Sign up today!

(Want a free daily e-mail update? If it's in the news, it's in our polls). Rasmussen Reports updates are also available on Twitter or Facebook.

The state survey of 1,000 Likely Voters in New Jersey was conducted October 7, 2013 by Rasmussen Reports. The margin of sampling error is +/- 3 percentage points with a 95% level of confidence. Field work for all Rasmussen Reports surveys is conducted by Pulse Opinion Research, LLC. See methodology.

White letter R on blue background
September 18, 2013

2016? Christie (R) 39%, Biden (D) 35%

Many suspect that Vice President Joe Biden went to Iowa this week to test the presidential waters. It's a long way off, but Biden's the winner matched against most of the current leading Republican contenders for 2016 - except New Jersey Governor Chris Christie. In a face-off with fellow Democrat Hillary Clinton, however, the vice president gets blown away.

The latest Rasmussen Reports national telephone survey finds that 77% of Likely Democratic Voters chose Clinton, while 11% prefer Biden. Six percent (6%) like some other candidate, and another six percent (6%) are undecided. (To see survey question wording, click here.)

Special Offer: Rasmussen Reader is now just $24.95 for a subscription through December 31, 2014. Sign up today!

(Want a free daily e-mail update? If it's in the news, it's in our polls).  Rasmussen Reports updates are also available on Twitter or Facebook.

The survey of 1,000 Likely Voters was conducted on September 16-17, 2013 by Rasmussen Reports. The margin of sampling error is +/- 3 percentage points with a 95% level of confidence. Field work for all Rasmussen Reports surveys is conducted by Pulse Opinion Research, LLC. See methodology

September 9, 2013

49% In Virginia Now Approve of Governor McDonnell’s Job Performance

Republican Governor Bob McDonnell now earns his lowest level of approval yet among Virginia voters. A new Rasmussen Reports telephone survey finds that 49% of Likely Virginia Voters now at least a somewhat approve of the job McDonnell is doing as governor.  That’s down from 59% in early June and 64% in July 2010. Forty-four percent (44%) disapprove, up from 34% in June.  The latest figures include 16% who Strongly Approve of the governor’s job performance and 20% who Strongly Disapprove.

Special Offer: Rasmussen Reader is now just $24.95 for a subscription through December 31, 2014. Sign up today!

(Want a free daily e-mail update? If it's in the news, it's in our polls).   Rasmussen Reports updates are also available on Twitter or Facebook.

The survey of 998 Likely Voters in Virginia was conducted on September 3-4, 2013 by Rasmussen Reports. The margin of sampling error is +/- 3 percentage points with a 95% level of confidence. Fieldwork for all Rasmussen Reports surveys is conducted by Pulse Opinion Research, LLC. See methodology. 

August 7, 2013

Christie Is Candidate GOP Voters Want Least As Their 2016 Nominee

New Jersey Governor Chris Christie holds a narrow lead among Republicans for the party’s 2016 presidential nomination, but even more GOP voters say he’s the candidate they least want to see nominated.

A new Rasmussen Reports national telephone survey finds that Christie earns 21% support when Republican voters are asked whom they would vote for if the party’s primary in their state were held today. Florida Senator Marco Rubio runs a close second with 18% of the GOP vote, followed by former Florida Governor Jeb Bush at 16% and Kentucky Senator Rand Paul with 15% of the vote.

Congressman Paul Ryan, the unsuccessful Republican vice presidential candidate in 2012, picks up 13% of the Republican vote, with Wisconsin Governor Scott Walker dead last at six percent (6%). Just three percent (3%) prefer another candidate, and eight percent (8%) are undecided. (To see survey question wording, click here.) 

(Want a free daily e-mail update? If it's in the news, it's in our polls). Rasmussen Reports updates are also available on Twitter or Facebook.

The survey of 1,000 Likely Voters was conducted on August 1-2, 2013 by Rasmussen Reports. The margin of sampling error is +/- 3 percentage points with a 95% level of confidence. Field work for all Rasmussen Reports surveys is conducted by Pulse Opinion Research, LLC. See methodology.

White letter R on blue background
August 6, 2013

Hillary Clinton Is Leading Favorite – And Unfavorite – in Democratic Presidential Pack

Hillary Clinton is the Democrat voters most want to see win her party’s presidential nomination in 2016 – and least want to see win that nomination, too. Among Democrats, she’s the overwhelming favorite.  A new Rasmussen Reports national telephone survey finds that 63% of Likely Democratic Voters would choose Clinton if the 2016 Democratic presidential primary were held in their state today. Vice President Joe Biden is a distant second with 12% support. Several other prominent Democrats muster five percent (5%) or less support from voters in their own party. (To see survey question wording, click here.)

Win an iPad: A new Rasmussen Challenge starts today!

The survey of 1,000 Likely Voters was conducted on August 1-2, 2013 by Rasmussen Reports. The margin of sampling error is +/- 3 percentage points with a 95% level of confidence. Field work for all Rasmussen Reports surveys is conducted by Pulse Opinion Research, LLC. See methodology.

July 23, 2013

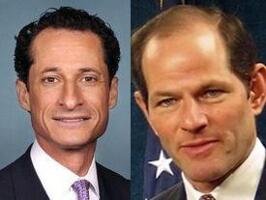
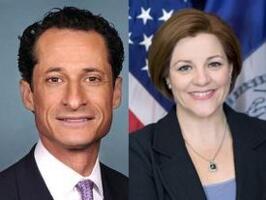
Half of NYC Voters Don’t Like Weiner, Spitzer

One-out-of-two New York City voters hold an unfavorable opinion of disgraced politicians Anthony Weiner and Eliot Spitzer who are both hoping to be returned to public office this fall.

The latest Rasmussen Reports telephone poll finds that 50% of Registered New York City Voters continue to view Weiner unfavorably, unchanged from mid-May. But now 40% have a favorable opinion of the married former congressman who was forced to resign after he was caught texting sexually suggestive photos of himself to women around the country. That’s up from 34% in the earlier survey.  The new findings include 18% with a Very Favorable opinion of Weiner and 29% with a Very Unfavorable one. (To see survey question wording, click here.)

Win an iPad : A new Rasmussen Challenge starts today! 

(Want a free daily e-mail update ? If it's in the news, it's in our polls). Rasmussen Reports updates are also available on Twitter or Facebook.

The survey of 1,000 Registered New York Voters was conducted on July 16-17, 2013 by Rasmussen Reports. The margin of sampling error is +/- 3 percentage points with a 95% level of confidence. Field work for all Rasmussen Reports surveys is conducted by Pulse Opinion Research, LLC. See methodology.

June 18, 2013

In New Jersey, 44% Would Vote for Christie for President

It’s the time in the political cycle when just about any Republican could be considered a presidential candidate. New Jersey Governor Chris Christie’s name comes up often in those discussions, but New Jersey voters aren’t convinced he should make the run.

Thirty-seven percent (37%) of Garden State voters would like to see a Christie campaign in 2016. However, a Rasmussen Reports statewide poll shows that 41% disagree and do not want him to run. Twenty-two percent (22%) are undecided. (To see survey question wording, click here.)

(Want a free daily e-mail update? If it's in the news, it's in our polls). Rasmussen Reports updates are also available on Twitter or Facebook.

The state survey of 1,000 Likely Voters in New Jersey was conducted June 12-13, 2013 by Rasmussen Reports. The margin of sampling error is +/- 3 percentage points with a 95% level of confidence. Field work for all Rasmussen Reports surveys is  conducted by Pulse Opinion Research, LLC. See methodology.

June 9, 2013

59% in Virginia Approve of McDonnell’s Performance as Governor

Most Virginians continue to like the job Governor Bob McDonnell is doing.

The latest Rasmussen Reports telephone survey of Likely Virginia Voters finds that 59% at least somewhat approve of McDonnell's job performance. Thirty-four percent (34%) disapprove. This includes Strong Approval from 20% and Strong Disapproval from 13%.  (To see survey question wording, click here.)

How did you do in the first week of the new Rasmussen Challenge? Check the leaderboard to see.

The survey of 1,000 Likely Voters in Virginia was conducted on June 5-6, 2013 by Rasmussen Reports. The margin of sampling error is +/- 3 percentage points with a 95% level of confidence. Fieldwork for all Rasmussen Reports surveys is conducted by Pulse Opinion Research, LLC. See methodology.
May 24, 2013

Democrats Quinn, Weiner Lead GOP’s Lhota in NYC Mayoral Race

Both current Democratic frontrunners outpace Republican favorite Joseph J. Lhota in Rasmussen Reports’ first look at New York City’s 2013 mayoral race.

November 8, 2012

Most Want GOP to Work With Obama, GOP Voters Disagree

Most voters feel it’s more important for Republicans to work with President Obama than stand up for what their party believes in. GOP voters overwhelmingly disagree, even as their party’s congressional leaders reach out to Obama to make a budget deal.

The latest Rasmussen Reports national telephone survey finds that 46% of Likely U.S. Voters believe the president set the right tone for the future with his victory speech Tuesday night. Thirty-two percent (32%) disagree and think he did not set the right tone. Twenty-two percent (22%) are not sure. (To see survey question wording, click here.)

How did you do in this week’s Rasmussen Challenge? Check the leaderboard.

(Want a free daily e-mail update? If it's in the news, it's in our polls). Rasmussen Reports updates are also available on Twitter or Facebook.

The national survey of 1,000 Likely Voters was conducted on November 7, 2012 by Rasmussen Reports. The margin of sampling error is +/- 3 percentage points with a 95% level of confidence. Fieldwork for all Rasmussen Reports surveys is conducted by Pulse Opinion Research, LLC . See methodology.

November 7, 2012

12% Made Their Presidential Pick Within The Last Week

For most voters, their decision to vote for President Obama or Mitt Romney wasn’t a last-minute thing. But four percent (4%) of Likely U.S. Voters finally made up their minds on Election Day.

A new Rasmussen Reports national telephone survey finds that 70% made up their minds about how to vote more than a month ago, while another 18% decided within the last month.

But five percent (5%) decided within the last week and three percent (3%) within the last few days. Combined with the four percent (4%) who reached a final decision at the very last minute, this means 12% of voters decided whom to vote for in the last seven days of the race. (To see survey question wording, click here.)

(Want a free daily e-mail update? If it's in the news, it's in our polls). Rasmussen Reports updates are also available on Twitter or Facebook.

The survey of 1,000 Likely Voters was conducted on November 6, 2012 by Rasmussen Reports. The margin of sampling error is +/- 3 percentage points with a 95% level of confidence. Field work for all Rasmussen Reports surveys is conducted by Pulse Opinion Research, LLC. See methodology.

November 7, 2012

56% Favor Eliminating the Electoral College

After yesterday’s election, voters by better than two-to-one favor getting rid of the Electoral College.

A new Rasmussen Reports national telephone survey finds that 56% of Likely U.S. Voters favor eliminating the Electoral College, while one-in-four (25%) are opposed. Eighteen percent (18%) are not sure. (To see survey question wording, click here.)

Win an IPad. Take the Rasmussen Challenge.

The survey of 1,000 Likely Voters was conducted on November 6, 2012 by Rasmussen Reports. The margin of sampling error is +/- 3 percentage points with a 95% level of confidence. Field work for all Rasmussen Reports surveys is conducted by Pulse Opinion Research, LLC. See methodology.
November 7, 2012

Plurality Believes Both Campaigns Were Negative

Voters think both presidential campaigns were more negative than positive this election cycle.

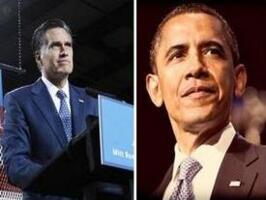
 The latest Rasmussen Reports national telephone survey finds that 40% of Likely U.S. Voters believe Mitt Romney’s campaign has been generally negative, while 39% say the same of President Obama’s campaign. (To see survey question wording, click here.)

 Win an IPad. Take the Rasmussen Challenge.

(Want a free daily e-mail update? If it's in the news, it's in our polls). Rasmussen Reports updates are also available on Twitter or Facebook.

The survey of 1,000 Likely Voters was conducted on November 6, 2012 by Rasmussen Reports. The margin of sampling error is +/- 3 percentage points with a 95% level of confidence. Field work for all Rasmussen Reports surveys is conducted by Pulse Opinion Research, LLC. See methodology.

November 6, 2012

Voters Don’t See Much Difference in the Candidates

Wonder why the presidential race is so close?

The Rasmussen Reports daily Presidential Tracking Poll finds Mitt Romney with 49% support nationally to President Obama’s 48%.

But consider these findings from a week’s worth of Rasmussen Reports surveys involving interviews with 7,000 Likely U.S. Voters. (To see survey question wording, click here.)

Win an IPad: Take the Rasmussen Challenge

(Want a free daily e-mail update ? If it's in the news, it's in our polls). Rasmussen Reports updates are also available on Twitter or Facebook.

The survey of 7,000 Likely Voters was conducted on October 29-November 4, 2012 by Rasmussen Reports. The margin of sampling error is +/- 1 percentage point with a 95% level of confidence. Field work for all Rasmussen Reports surveys is conducted by Pulse Opinion Research, LLC. See methodology.

November 5, 2012

New Hampshire Governor: Hassan (D) 50%, Lamontagne (R) 45%

Democrat Maggie Hassan has pulled ahead of Republican Ovide Lamontagne on the eve of New Hampshire’s gubernatorial election.  The latest Rasmussen Reports telephone survey of Likely New Hampshire Voters finds Hassan with 50% of the vote to Lamontagne’s 45%. One percent (1%) prefers some other candidate, and four percent (4%) are undecided. (To see survey question wording, click here.)

(Want a free daily e-mail update ? If it's in the news, it's in our polls). Rasmussen Reports updates are also available on Twitter or Facebook.

This New Hampshire survey of 750 Likely Voters was conducted on November 4, 2012 by Rasmussen Reports. The margin of sampling error is +/- 4 percentage points with a 95% level of confidence. Field work for all Rasmussen Reports surveys is conducted by Pulse Opinion Research, LLC. See methodology.