Election 2024: How Did We Do?
The three most important things in polling are accuracy, accuracy and accuracy. Now that the results of the 2024 election are known, we’re happy to report that Rasmussen Reports maintained its standing as one of America’s most accurate polling organizations, according to several metrics. Before we plunge into the numbers, however, let’s explain a few things about what it is we do here on a year-round basis.
Day after day, week after week, Rasmussen Reports publishes polls on all kinds of topics, but of all the surveys we publish, the only polling that can be measured against an objective standard are election polls. When the votes are counted, this number can be compared to our poll – or any other poll – and the accuracy can then be determined. For this reason, Rasmussen Reports puts a lot of work into trying to ensure that our methodology yields numbers based on a representative sample of the electorate. Otherwise, our polls would be an unreliable guide to election outcomes. And if we can’t get the election numbers right, why should anyone trust our surveys on any other topic? Any polling organization’s reputation stands or falls on the accuracy of its election polling.
The “secret sauce” of polling is a process called sample weighting. Suppose you collect responses from a random group of 2,000 American adults, of whom 1,500 answer “yes” to screening questions about the likelihood of them voting in the next election. This sample of 1,500 Likely Voters, chosen randomly, may not be representative of the electorate, so the data is weighted according to demographic characteristics – male or female, age, race, etc. – to account for such discrepancies. Also, based on exit polls in previous elections, we weight the sample to reflect the partisan affiliations of the electorate. For national surveys, Rasmussen Reports weights Likely Voters as 35% Democrat, 33% Republican and 32% independent. The shorthand for this weighting is D+2 – slightly more Democrats than Republicans.
Beginning in late July, when Joe Biden announced he would not seek reelection and designated Kamala Harris to take his place as the Democratic Party’s presidential candidate, Rasmussen Reports published weekly national polls of the race between Harris and Donald Trump. For the first time ever, we also began publishing our overnight weighted samples, something so unique in the industry that it was featured multiple times in campaign rallies. Then, beginning October 15, we switched to publishing a daily tracking poll, with each day’s results based on the average of four nights of survey data. (Click here for the archive of our national presidential polling.) On November 1, the Friday before Election Day, we published our final “mega-poll,” aggregating data from more than 12,000 Likely Voters surveyed over the course of three weeks: Trump 49%, Harris 46% – Trump +3. (To be more exact, it was Trump 48.7% to Harris 46.3%, a margin of Trump +2.4.) The latest official count of votes nationally has Trump at 50% and Harris at 48.4% – Trump +1.6. This means:
A) Rasmussen Reports correctly identified the winner; and
B) We missed the actual margin of victory by less than one percentage point, within the margin of error.
However, this is not the whole story. Go look at the Real Clear Politics (RCP) average of national polls. Of the 17 separate polls comprising the final average, seven of them predicted a Harris victory, five showed the race absolutely tied, and Rasmussen was one of only five showing Trump ahead (the other four being Fox News, CNBC, the Wall Street Journal and Atlas Intel). The award for the very worst national poll of 2024 goes to the Marist College Institute for Public Opinion, whose final poll (sponsored by National Public Radio and the Public Broadcasting Service) had Harris winning by a margin of four points, 51% to 47%.
Yet the comparison of final numbers in national polls doesn’t quite suffice to address questions about accuracy, especially concerning the accusation of bias in polling. What about earlier polls, many of which had shown Harris with substantial leads, suggesting the Democrat was riding a wave of momentum toward a probable victory in November?
Scroll down the page at Real Clear Politics, and you’ll see that the RCP average had Harris surging ahead in August, so that by September 1, she led the average by nearly two full points, with 48.1% to Trump’s 46.2%. What caused this apparent surge? A number of polls – including ABC News, Reuters, Emerson College and Morning Consult – had Harris leading by four points in August. In September came a series of polls – by many of the same organizations – showing Harris leading by five or even six points. The effect of these polls was to skew the RCP average toward Harris.
Guess what? Of the nine national surveys published by Rasmussen Reports in August and September, Trump led all of them. And during a period of seven weeks, from August 29 to October 10, six of those weekly polls by Rasmussen Reports had Trump leading by two points, with one (September 5) showing his lead at one point. In other words, during two months when many pollsters were wrongly projecting a blowout victory for Harris, Rasmussen Reports was steadily predicting that Trump would win by nearly the exact margin of his final victory.
‘Battlegrounds’ and Other States
As everyone who paid attention in middle school social studies classes knows, the president is not elected by popular vote, but rather by a majority of the Electoral College. Polling state elections is more difficult than polling nationally for a number of reasons; a state may experience significant changes in demographics and party affiliation in the four years between presidential elections. For example, Florida has become more Republican in recent years because Republican-leaning voters have moved there from other states. But if thousands of those GOP-friendly voters fled Michigan (or Pennsylvania, Wisconsin, etc.), how might that affect the electorate in the states they left behind?
Going into the 2024 campaign, analysts had identified seven states – Arizona, Georgia, Michigan, Nevada, North Carolina, Pennsylvania and Wisconsin – as being the “battleground” states that would decide the Electoral College. Five of those (Arizona, Georgia, Michigan, Pennsylvania and Wisconsin) had been won by Trump in 2016 but “flipped” to Biden in 2020. Trump had won North Carolina twice, but by relatively narrow margins. Nevada had been won by both Biden in 2020 and Hillary Clinton in 2016, but by narrow margins both times.
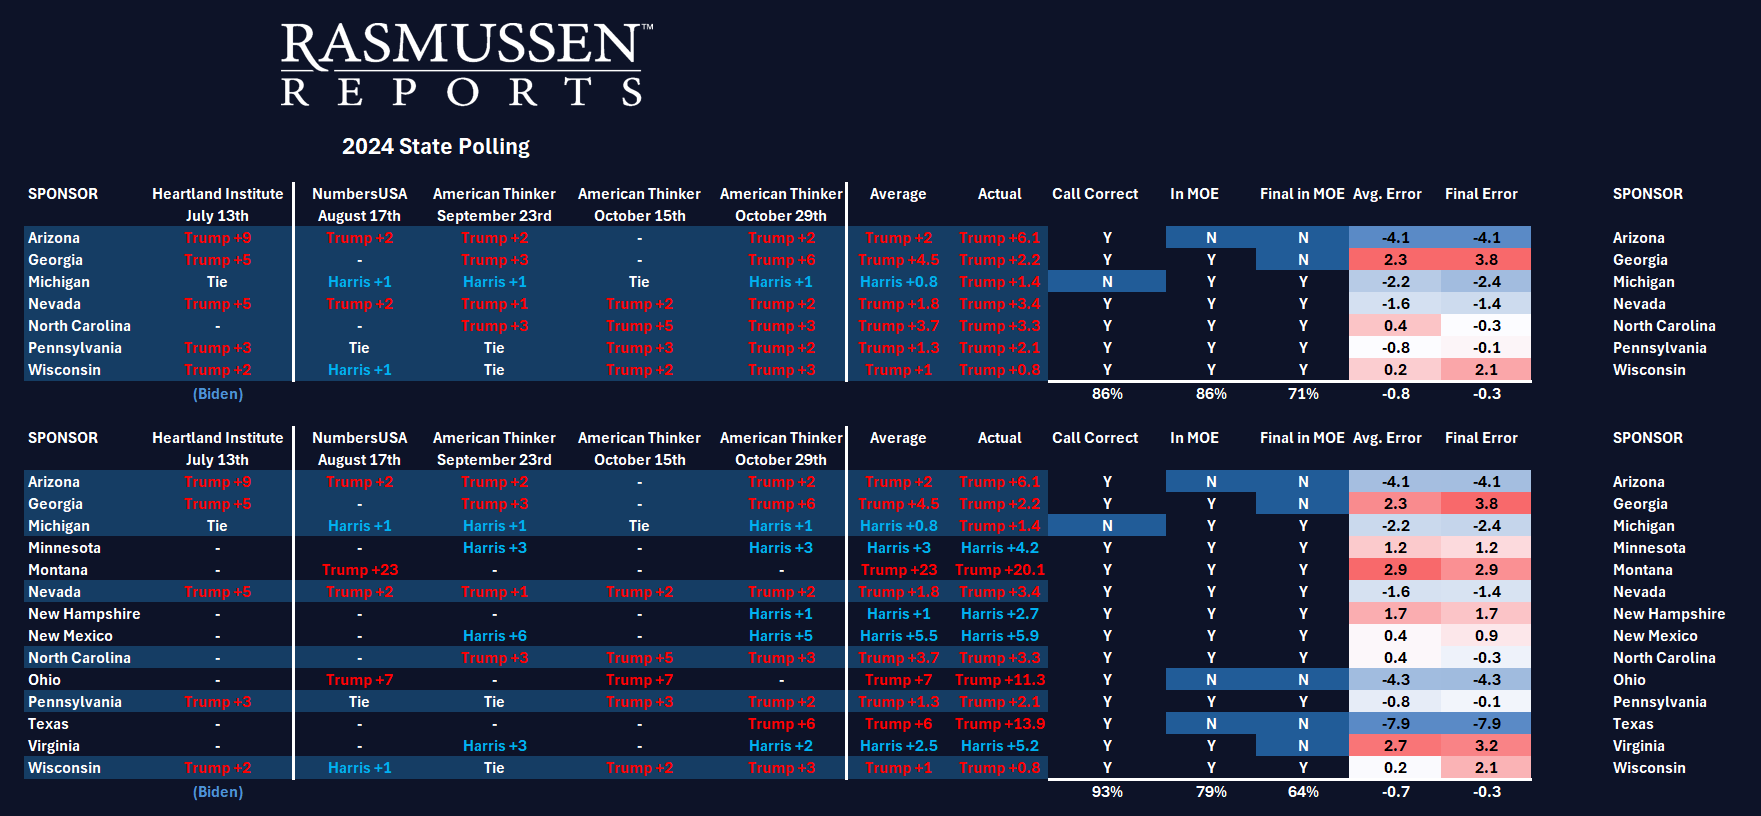
Between mid-August and late October, Rasmussen Reports conducted 24 polls in these seven states: Michigan, Nevada, Pennsylvania and Wisconsin were each surveyed four times; Arizona and North Carolina were surveyed three times; Georgia was surveyed twice.
Of the seven “battlegrounds,” Rasmussen Reports correctly identified Trump as the winner in six, the only wrong call being in Michigan, where we had Harris leading by one point in our final poll, and Trump won by a 1.4-point margin. However, Rasmussen Reports did better than most polls in calling the battleground states, since the RCP average for Wisconsin had Harris leading in a state that we correctly predicted Trump would win. (The worst Wisconsin poll was by CNN, which had Harris leading by six points there.)
In addition to the seven battlegrounds, Rasmussen Reports also conducted surveys of seven other states between mid-August and late October: Minnesota, New Mexico, Ohio and Virginia were each surveyed twice, while Montana, New Hampshire and Texas were surveyed once each. In all of these states, our polls correctly identified the presidential winner, including some where Rasmussen Reports was clearly more accurate than other pollsters. For example, in New Hampshire, three October polls (by the University of New Hampshire, St. Anselm College and the University of Massachusetts at Lowell) had Harris leading by an average 6.3 points. Rasmussen Reports had Harris leading by just one point in New Hampshire. On Election Day, Harris’s margin was 2.8 points – we were within two points; the average of other pollsters in New Hampshire was more than three points off.
Senate and Congressional Races
In addition to the presidential election, Rasmussen Reports also polled several Senate races, as well as the elections for the House of Representatives. In the latter case, the so-called “generic ballot” question asks voters whether they will vote for the Democratic or Republican congressional candidate. Our final survey had Republicans +3 on the generic ballot – exactly on the money, according to the Cook Political Report, which has the GOP with 50.7% to 47.7% for Democrats. By comparison, the RCP average had Republicans +0.3% on the generic ballot, and five pollsters ((NPR/PBS/Marist, NBC News, Emerson, Yahoo News and USA Today/Suffolk) actually had Democrats winning in their final generic ballot survey.
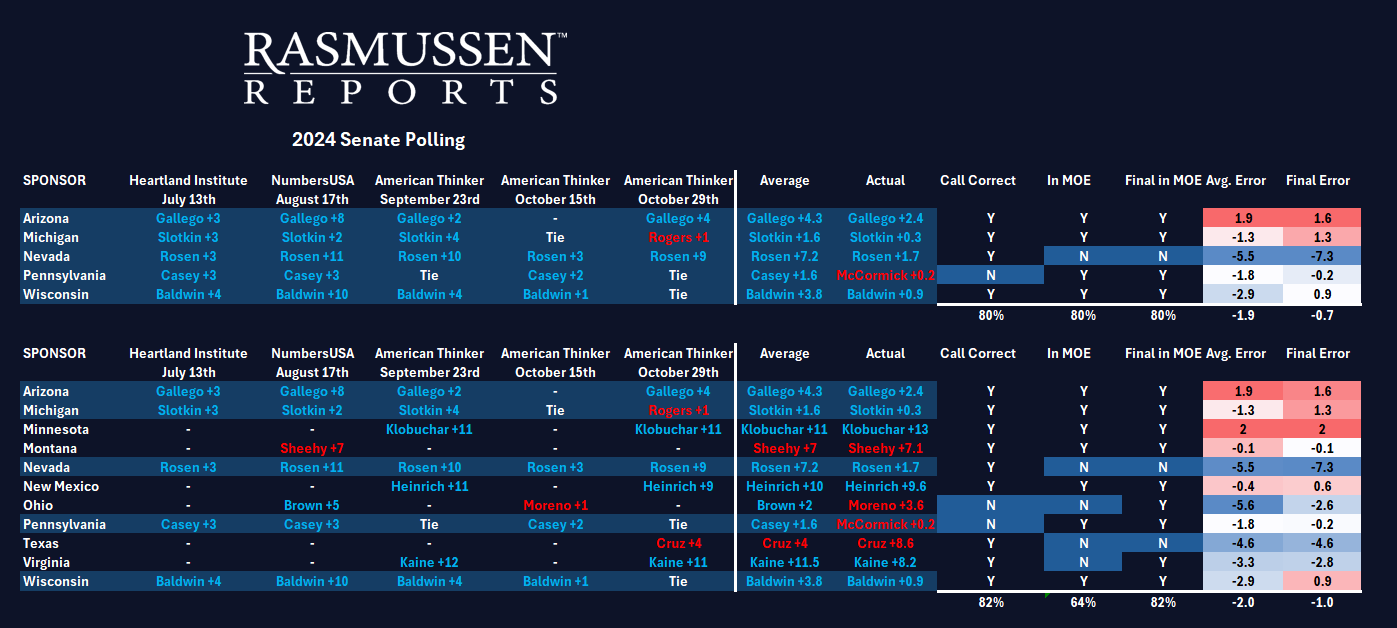
In 2024, Rasmussen Reports conducted 32 separate polls of 11 different Senate races: Michigan, Nevada, Pennsylvania and Wisconsin were each surveyed five times; Arizona was surveyed four times; Minnesota, Ohio and Virginia were each surveyed twice; Montana and Texas were surveyed once each. We got the winner right in 10 of our final Senate polls, the lone exception being Michigan, where we had Republican challenger Mike Rogers one point ahead in our final poll; incumbent Democrat Sen. Elissa Slotkin won reelection by a 0.3% margin.
In Wisconsin, we had the Senate race tied in our final poll, and incumbent Democratic Sen. Tammy Baldwin was reelected by a 0.9-point margin over Republican challenger Eric Hovde. Our final poll in Pennsylvania also showed a tie in the Senate race, which Republican Dave McCormick won by a margin of 0.2% over incumbent Sen. Bob Casey Jr. Both of these results are close enough to a tie that we can say we got it right.
In Ohio, while our August poll had incumbent Democratic Sen. Sherrod Brown leading by five points, our October survey found Republican challenger Bernie Moreno ahead by one point, and Moreno won by 3.8 points. Elsewhere, we significantly overestimated the winning margin for Democrat Jacky Rosen in Nevada and similarly underestimated Ted Cruz’s reelection margin in Texas. We nailed it dead on the money in Montana, where Republican Tim Sheehy defeated incumbent Democratic Sen. Jon Tester.
Polling Error vs. Polling Bias
After the 2016 election, questions about bias in polling were raised, because so many polls had shown Hillary Clinton winning an election that Trump ultimately won. How bad was it? For example, two weeks before Election Day 2016, an ABC News poll showed Clinton leading by 12 points – a blowout margin – while the final poll by NBC News had Clinton ahead by seven points, which was nearly five points more than her actual popular-vote margin in an election where she lost all the key battleground states. Rasmussen Reports was the most accurate pollster in that election.
After their 2016 embarrassment, other pollsters vowed to do better in 2020, but in many cases, they ended up doing even worse. For example, the final NBC News/Wall Street Journal poll in 2020 had Joe Biden winning by a 10-point margin – more than double his 4.5-point margin in official election results.
Such results point to the crucial difference between error and bias. Any polling organization that does multiple surveys during an election year will have some amount of error in their results. Even if a pollster gets the national margin exactly right, there will likely be varying degrees of accuracy in state survey results. However, the question of partisan bias only comes into play if a pollster’s errors routinely favor one party over the other, and this issue was raised by the fact that, in both 2016 and 2020, the average error of polls favored the Democrats – by 1.1 points in 2016, and by 2.7 points in 2020, according to Real Clear Politics. And the same pattern continued in 2024, with the average polling error favoring Democrats by 1.6 points.
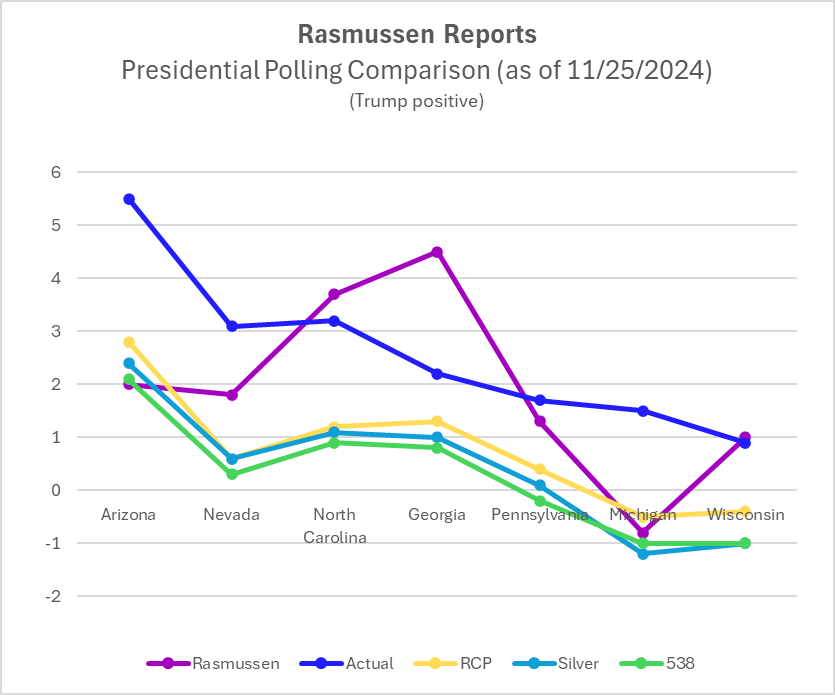
The chart below compares the actual vote results (blue line) in the seven battleground states to the final Real Clear Politics average (yellow line) for those states, as well as the final predictions of ABC News 538 (green line) and polling analyst Nate Silver (turquoise line), with the average of Rasmussen Reports battle ground surveys (purple line):
As you can see, the RCP average was substantially below the actual total (i.e., underestimating Trump) in every battleground state. But the numbers from both 538 and Nate Silver were actually worse than the RCP average, which is to say, their statistical models – which claim superior accuracy based on weighting different polls by “quality” – actually introduced more bias (against Trump) than the average poll.
Meanwhile, although Rasmussen Reports had some errors in the battleground states, there was no bias – no pattern of partisan favoritism in the errors. We were nearly exact in three states (North Carolina, Pennsylvania and Wisconsin), we overestimated Trump’s support in Georgia, and we underestimated Trump’s support in three states (Arizona, Nevada and Michigan). If anything, we were generally too favorable toward Harris, which is the opposite of what our critics have often claimed.
All things considered, 2024 was another successful national election cycle for Rasmussen Reports, where we judge our success by three factors – accuracy, accuracy and accuracy.
Rasmussen Reports is a media company specializing in the collection, publication and distribution of public opinion information.
We conduct public opinion polls on a variety of topics to inform our audience on events in the news and other topics of interest. To ensure editorial control and independence, we pay for the polls ourselves and generate revenue through the sale of subscriptions, sponsorships, and advertising. Nightly polling on politics, business and lifestyle topics provides the content to update the Rasmussen Reports web site many times each day. If it's in the news, it's in our polls. Additionally, the data drives a daily update newsletter and various media outlets across the country.
Some information, including the Rasmussen Reports daily Presidential Tracking Poll and commentaries are available for free to the general public. Subscriptions are available for $4.95 a month or 34.95 a year that provide subscribers with exclusive access to more than 20 stories per week on upcoming elections, consumer confidence, and issues that affect us all. For those who are really into the numbers, Platinum Members can review demographic crosstabs and a full history of our data.
To learn more about our methodology, click here.


