Presidential Approval: Comparing the Numbers
So how does America view the sitting President these days? It depends on how you ask the question and whom you ask.
Rasmussen Reports in our daily Presidential Tracking Poll gives respondents four options – Strongly Approve, Somewhat Approve, Somewhat Disapprove and Strongly Disapprove - as opposed to just two - Approve/Disapprove. We are also the one major national pollster who asks this question only of likely U.S. voters, those who tell us they are likely to vote in the next election.
Other major pollsters regularly monitored by the nationally recognized Real Clear Politics website ask their presidential approval questions of registered voters only (CNN/Opinion Research, The Economist/YouGov, ABC News/Washington Post, Fox News and Quinnipiac) or of all Americans (Gallup and CBS News).
All of these polls also with the exception of The Economist/You Gov ask only approve/disapprove and don’t give the respondents the “somewhat” options. Gallup and Rasmussen are the only ones who ask every day.
What we have found over the years is that our standards – asking likely voters only and offering the somewhat approve/somewhat disapprove options – lead to fewer surprising highs and lows than other pollsters find. These dramatic changes, however, aren’t always long-lasting or a realistic measure of how Americans will vote. Still, we often see similar trends developing over time, but we believe our daily findings are a more accurate representation of where the country’s attitudes are at - and are a more accurate reflection of voting outcomes.
Because our daily numbers are less likely to produce dramatic surprises, some of those opposed to President Obama, for example, think that we are not as reliable as pollsters who show him with a higher disapproval rating. Those opposed to President Bush complained about the same thing five or six years ago.
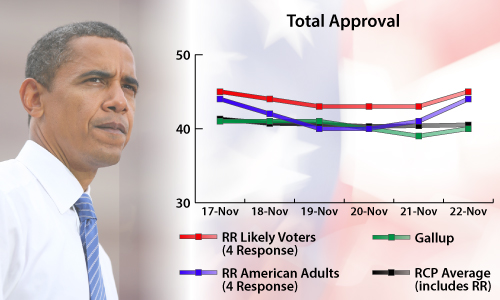
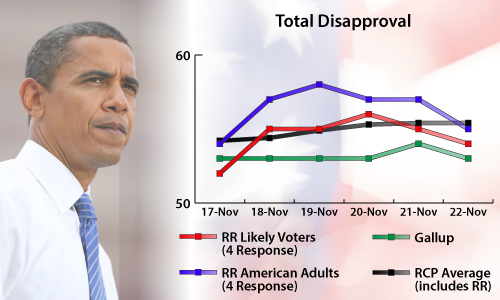
To help our readers understand the differences, we ran parallel presidential approval surveys over the past week, and this is what we found:
-- Americans tend to be more negative overall than likely voters.
-- Not giving respondents the “somewhat” options leads to higher overall disapproval numbers, even among identical sets of likely voters.
See for yourself:
Rasmussen Reports is a media company specializing in the collection, publication and distribution of public opinion information.
We conduct public opinion polls on a variety of topics to inform our audience on events in the news and other topics of interest. To ensure editorial control and independence, we pay for the polls ourselves and generate revenue through the sale of subscriptions, sponsorships, and advertising. Nightly polling on politics, business and lifestyle topics provides the content to update the Rasmussen Reports web site many times each day. If it's in the news, it's in our polls. Additionally, the data drives a daily update newsletter and various media outlets across the country.
Some information, including the Rasmussen Reports daily Presidential Tracking Poll and commentaries are available for free to the general public. Subscriptions are available for $4.95 a month or 34.95 a year that provide subscribers with exclusive access to more than 20 stories per week on upcoming elections, consumer confidence, and issues that affect us all. For those who are really into the numbers, Platinum Members can review demographic crosstabs and a full history of our data.
To learn more about our methodology, click here.
