Polling Error in 2016-2020: Look Out for Wisconsin
A Commentary By Kyle Kondik
KEY POINTS FROM THIS ARTICLE
— Swing state polls show an incredibly close race in our 7 Toss-up presidential states right now.
— Final polling did generally overstate Democrats in both the 2016 and 2020 elections in these states, with Wisconsin standing out. Keep that in mind as polling shows Kamala Harris holding up a little bit better in the Badger State than elsewhere.
— If polls are understating Donald Trump again, he of course is in a great position to win given how competitive he already is in the core swing states. But there are good reasons to believe that he is not being overstated this time.
What the polls actually said at the end of the last two elections
It is hardly a profound statement to say that the heavily-contested swing states in the presidential election, the septet of Arizona, Georgia, Michigan, Nevada, North Carolina, Pennsylvania, and Wisconsin, are all achingly close. Table 1 shows the state of play in all 7: We averaged the RealClearPolitics and FiveThirtyEight polling averages together to get these figures. The two averages include a different mix of polls, and RealClearPolitics uses a straight average of recent polls to come up with its numbers while FiveThirtyEight makes some adjustments.
Table 1: Averaged RCP/538 swing state presidential polling averages
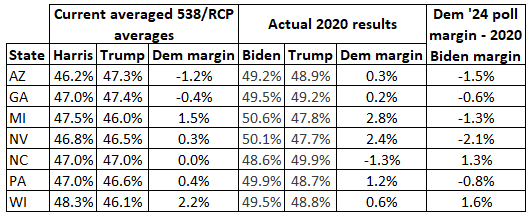
Notes: Head-to-head Harris versus Trump polling average from RealClearPolitics and FiveThirtyEight as of Wednesday afternoon. Margins and differences may not add up precisely because of rounding.
Sources: RealClearPolitics and FiveThirtyEight
A majority of these states (4 of the 7) either show an average lead for either candidate below a half a percentage point or is tied (North Carolina), and the largest lead—Harris’s in Wisconsin—is the only one that hits the 2-point mark, and only barely. Notice that there’s not a big difference between the current polling average margin and the actual 2020 results, although Harris is more often than not running a bit behind Joe Biden’s 2020 margins in these states. Wisconsin and North Carolina show Harris doing the best compared to the actual 2020 Biden margin.
In particular, Wisconsin polling this cycle has held up relatively well for Democrats, even though the state has been close in polls (as it remains).
John McCormack, senior editor at the center-right publication The Dispatch, posted a reasonable question over the weekend. Sharing screenshots of Pennsylvania and Wisconsin polling averages, he asked “In 2016, Trump’s margin of victory was almost identical in Wisconsin (0.77%) and Pennsylvania (0.72%). In 2020, Biden’s margin of victory was a half point greater in Pennsylvania than Wisconsin. In 2024, is it likely Wisconsin will be 2 points more Dem than Pennsylvania?”
It’s not impossible that Wisconsin would be more Democratic than Pennsylvania—a 2-point difference in 2020 is not some sort of impassable gulf. However, we share McCormack’s questions about the relative ordering of Pennsylvania and Wisconsin this year at least in part because, as we’ll lay out below, Wisconsin stands out as having had unrealistically optimistic polling for Democrats in both the 2016 and 2020 presidential elections, even compared to other key states where Democrats were also overstated in those election years.
Tables 2 and 3 show the final pre-election polling average for these 7 key states in 2016 (Table 2) and 2020 (Table 3) compared to the actual results. We created the average the same way we did in Table 1, by taking the final averages from FiveThirtyEight and RealClearPolitics and averaging them together to get a single average.
Table 2: 2016 final polling average versus actual results
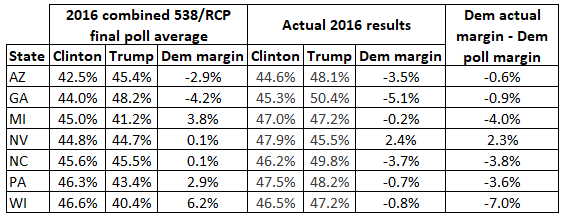
Note: Margins and differences may not add up precisely because of rounding. Four-way (including Hillary Clinton, Donald Trump, Gary Johnson, and Jill Stein) RealClearPolitics polling averages used in 2016 for Arizona, Michigan, Pennsylvania, and Wisconsin. Three-way (Clinton, Trump, and Johnson) used for Georgia, Nevada, and North Carolina. Final FiveThirtyEight polling average, which listed Clinton, Trump, and Johnson, used in all 2016 states.
Sources: RealClearPolitics and FiveThirtyEight
Table 3: 2020 final polling average versus actual results
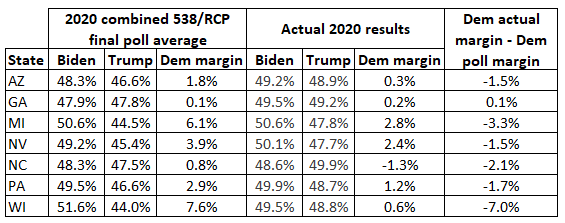
Note: Margins and differences may not add up precisely because of rounding. Head-to-head Biden versus Trump averages were used for both RealClearPolitics and FiveThirtyEight
Sources: RealClearPolitics and FiveThirtyEight
In the far-right column on each table, a negative number means that the actual margin was more Republican than the margin in the final polling average, and a positive number means that the final result was more Democratic than the final polling average.
The biggest and most obvious takeaway is that the Democratic margin was overstated in almost every instance, the only exceptions being Nevada in 2016 and Georgia in 2020 (ever so slightly).
However, it’s also the case that the polling averages actually performed very well in some of these states. For instance, the polling averages in both Arizona and Georgia in both years were impressively close to the final results.
Michigan, Pennsylvania, and Wisconsin stand out for having polls that were too Democratic-leaning compared to the final result in each year: That was particularly true in Wisconsin, which had an error of 7 points in both elections. The Wisconsin polling produced some exceedingly big misses from prominent pollsters: New York Times/Siena College had Biden up 11 points in its final 2020 Wisconsin survey, and ABC News/Washington Post had Biden up a staggering 17 points. Democratic performance was also overstated by a couple of points or more in North Carolina in both elections. Nevada overstated Trump in 2016 and then Biden in 2020.
To be clear, we have no idea whether the polls will be biased consistently one way or the other in 2024. Maybe Trump will be understated again: if so, he is almost certainly going to win the election given how close the polls are now. Maybe Harris will be understated: if so, she is in a great position to win given that she appears to already lead in enough states to win 270 electoral votes, albeit barely. Or there might be little bias either way, or inconsistent bias depending on the state, in which case this election will be very hard to confidently predict based on the current numbers. Polling error is not necessarily consistent from year to year—while polls understated Trump in 2016 and 2020, the longer-term history of polling errors is a bit more mixed, per this helpful chart from the Pew Research Center based on American Association for Public Opinion Research data.
Our best guess is that because Trump’s polling position is better than 2016 and 2020, it’s likelier that he’s at least not being as underestimated as much as he was in previous elections, if he is being underestimated at all. For one thing, other indicators do not really suggest that we’re in the midst of an electoral environment that is much stronger for Republicans than the past two elections (those indicators include special elections in 2023 and 2024 and the recent Washington state top-two primary). While Democrats have now nominated three different opponents against Donald Trump, Trump himself will be on the ballot for a third straight time. It just doesn’t seem likely to us that he will do markedly better than he did in either 2016 or 2020, which is what would happen if the polls were biased against him again. The third installment of the Trump trilogy will likely look a fair amount like the first two installments as opposed to being dramatically different; this is why we’ve long expected a close and competitive election, with only the last few weeks of Joe Biden’s candidacy really making us seriously consider the possibility of Trump doing substantially better than his previous presidential runs. The close polls suggest a close election: That seems realistic.
However, we also are on guard for subtler versions of the polling error we saw in 2016 and 2020. Again, Harris doing better in Wisconsin than she is doing in Michigan and Pennsylvania is something that raises our eyebrows, given actual recent results and the more pronounced Wisconsin polling error in 2016 and 2020. We also are suspicious of Harris’s better polling position in North Carolina than Georgia; note that the polling was generally closer to the mark in the latter than the former in both 2016 and 2020.
We realize we are comparing polling averages in just a pair of elections to this year; these are hardly large sample sizes for the sake of analysis. The exact ordering of the states doesn’t have to exactly mirror 2016 and 2020 (we went over how these key states voted relative to one another in a recent Crystal Ball story). Maybe Wisconsin is bluer than Pennsylvania (or even Michigan) in 2024; maybe North Carolina votes to the left of Georgia, as it generally did prior to 2020. But don’t just assume those things are going to happen because polls suggest that they could or should.
(For some theories from pollsters across the political spectrum about whether there will be poll bias in 2024 and what may have caused it in 2016 and 2020, we recommend this recent piece from Christian Paz at Vox.)
Kyle Kondik is a Political Analyst at the Center for Politics at the University of Virginia and the Managing Editor of Sabato's Crystal Ball.
See Other Political Commentary by Kyle Kondik.
See Other Political Commentary.
Views expressed in this column are those of the author, not those of Rasmussen Reports. Comments about this content should be directed to the author or syndicate.
Related Articles

Rasmussen Reports is a media company specializing in the collection, publication and distribution of public opinion information.
We conduct public opinion polls on a variety of topics to inform our audience on events in the news and other topics of interest. To ensure editorial control and independence, we pay for the polls ourselves and generate revenue through the sale of subscriptions, sponsorships, and advertising. Nightly polling on politics, business and lifestyle topics provides the content to update the Rasmussen Reports web site many times each day. If it's in the news, it's in our polls. Additionally, the data drives a daily update newsletter and various media outlets across the country.
Some information, including the Rasmussen Reports daily Presidential Tracking Poll and commentaries are available for free to the general public. Subscriptions are available for $4.95 a month or 34.95 a year that provide subscribers with exclusive access to more than 20 stories per week on upcoming elections, consumer confidence, and issues that affect us all. For those who are really into the numbers, Platinum Members can review demographic crosstabs and a full history of our data.
To learn more about our methodology, click here.