Places to Watch, Part Two: The Sun Belt
A Commentary By J. Miles Coleman
KEY POINTS FROM THIS ARTICLE
— In North Carolina, Kamala Harris seems likely to gain in suburban Cabarrus County but may have to watch rural counties like Wilson.
— While it is not the most likely case, two Georgia counties that have trended in the opposite direction, Fayette and Sumter, could both conceivably flip.
— While Phoenix’s Maricopa County dominates Arizona, raw vote margins in a trio of its other large counties have proved predictive.
— In Nevada, Las Vegas and Reno predominate.
Places to watch in the Sun Belt
A couple of weeks ago, we began our series examining some benchmark counties in our presidential Toss-up states. While our focus was then on the three “Blue Wall” states, today we are shifting to the Sun Belt battlegrounds of Arizona, Georgia, Nevada, and North Carolina, highlighting certain places we’ll be watching closely on Election Night. On a housekeeping note, much of the data throughout this article comes via DRA 2020 and Redistricter.
North Carolina
Over the past decade, Charlotte’s Mecklenburg County has steadily become bluer. In the Obama era, statewide Democrats would sometimes fall below 60% there—they now routinely claim about two-thirds of its vote. However, this county of just over 1 million residents is still something of a lonely blue bastion: it is surrounded by five Republican-leaning counties that contain many of Charlotte’s suburban and exurban communities. Themselves claiming nearly 1 million residents, the counties that surround Mecklenburg have, individually, exhibited some mixed political trends since 2012 but, in aggregate terms, they have hardly budged: Donald Trump’s 62%-37% spread there was down only slightly from Mitt Romney’s 63%-36%. Republicans largely retaining their margins in this group helps explain why North Carolina has, for Democrats, remained stubbornly out of reach in presidential races with the exception of Barack Obama’s win there in 2008.
However, of this suburban lot, the county that has shifted the most, in either direction, is Cabarrus County, which takes in some of the Charlotte metro area’s eastern communities. While Trump still carried it with 54% of the vote in 2020, Cabarrus County was the only North Carolina county that swung more than 10 percentage points away from him, if barely so (his margin was 10.2% worse there).
Since 2000, Cabarrus County’s population has about doubled. Much of that growth has been concentrated along Interstate 85—the county includes Concord Mills mall, one of the state’s most popular attractions, which is visible on I-85 just as one drives east out of Charlotte. In 2008, as Obama carried the state, he lost Concord by 10 points—making up close to half the county’s population, it is the largest city there. Twelve years later, Biden lost the state by a little less than 1.5% but carried Concord by about that same small margin. During that span, the city’s nonwhite share rose from 33% to 47%. While this probably accounts for much of its political shift, it is not hard to see younger, white liberal voters moving into the area to escape rising rents in Charlotte.
The county’s other notable city is Kannapolis, which is further north along I-85 and is known to racing fans as the hometown of the Earnhardt family. While Concord and Kannapolis are, taken together, mildly Republican-leaning, GOP margins in the county are padded by a handful of less-urbanized eastern precincts that still give Republicans 3-to-1 margins.
At the presidential level, it would be a surprise if Harris actually flipped Cabarrus County, but we’re looking to see how far she can move beyond Biden’s 44.5%. Gov. Roy Cooper (D) came within 5 points there in 2020—those aforementioned eastern precincts kept it out of his reach—and given the trajectory of the gubernatorial race this year, it seems like an excellent flip opportunity for state Attorney General Josh Stein (D).
Considering that, a realistic goal for Harris may be to replicate Cooper’s 2020 showing. In fact, Cooper’s electoral career helps speak to the changes that Cabarrus County has seen. While his 47% there is the Trump-era Democratic high-water mark, he was also the most recent Democrat to carry it in a major partisan state race: in 2008, he was reelected to a third term as Attorney General in a landslide and narrowly won the county. Map 1 shows those two elections, and the change between them.
Map 1: 2008 vs 2020 in Cabarrus County, NC
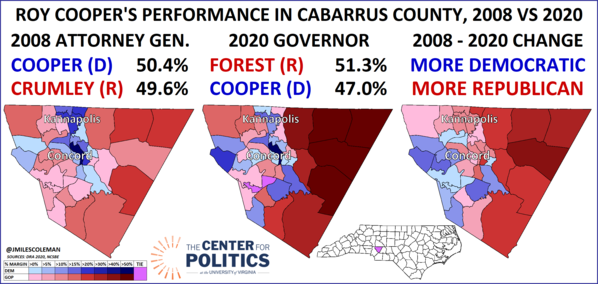
Precincts that swung to Cooper during that 12-year span tended to hug the western border of the county, which touches Mecklenburg County. While Cooper lost ground in most precincts, the 14 precincts that moved towards him are making up an increasing share of the electorate: in 2020, they cast 45% of the county’s votes, up from just under 41% in 2008.
As Biden gained in suburban counties like Cabarrus, much of rural North Carolina continued drifting to Trump: in fact, despite a closer presidential topline in 2020, 51 of the state’s 100 counties swung to Trump. The counties that moved furthest right generally fell within or around North Carolina’s portion of the “Black Belt”—though the name refers to the soil, not the people, this stretch of eastern North Carolina contains much of the state’s rural Black population. In 2022, this trend held: now-Sen. Ted Budd (R) beat Trump’s percentage margins in almost every county east of Raleigh.
In presidential elections since 2008, Democrats have consistently carried Wilson County—the home of former Gov. Jim Hunt (D) and former Rep. G. K. Butterfield (D, NC-1)—by single-digit margins. Biden, though, came the closest to losing it, carrying it only 51%-48%. As part of Budd’s overperformance in this region, he carried it by that same margin. With a population of 80,000 that is 40% Black, Wilson County is not especially large, but it has moved in sync with several demographically comparable midsize counties in its region.
In 2022, Democrats clearly did not do enough to energize the Black vote in eastern North Carolina. Wilson County’s Black-majority precincts are in the center of the county (within the city of Wilson)—they cast less than 17% of the countywide vote in 2022, down from just over 20% in 2020. In the Obama-era midterms, Wilson County still backed losing Democratic nominees for Senate in large part because those precincts accounted for 22% of its total vote.
If Trump flips Wilson County, it would likely be a sign that Democratic enthusiasm is still lagging in counties outside the state’s large metro areas.
Aside from the presidential race, Wilson County may also tell us something about how the Toss-up NC-1 race is shaping up. In 2022, now-Rep. Don Davis (D) replaced the aforementioned Butterfield and carried Wilson County by half a percentage point—weaker than Biden’s showing, but several points better than the Senate margin. With a new and less friendly district, this seems like the type of place Davis would want to carry by a more decisive margin. A recent poll from Noble Predictive Insights shows Harris is still very competitive in the district, leading Trump 47%-46%. That poll gave Davis a 6-point lead, although he only took 42% of the vote.
Georgia
Since 2004, Democrats have flipped a half-dozen counties in the Atlanta metro area. While Biden didn’t add any new counties to Hillary Clinton’s 2016 coalition in 2020—he simply expanded on her margins—the county that seems next in line to flip is Fayette, which is immediately south of Atlanta’s Fulton County. In 2020, Trump carried it 53%-46%, down from his 57%-38% win from 2016.
Republicans can still sweep the precincts in southern and western Fayette County, where the population center is Peachtree City. But the northern part of the county, which is anchored by Fayetteville, has grown at a faster rate over the past few decades and is voting more in line with nearby Henry County—which is to say, quickly in the blue direction.
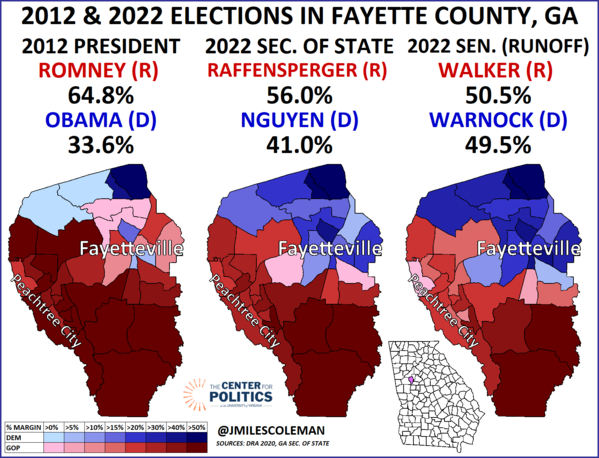
In 2022, Secretary of State (and new Center for Politics scholar) Brad Raffensperger led the Republican ticket statewide. Raffensperger’s 56%-41% vote in Fayette County was impressive by Trump-era standards, but it was not the 30-point spread that Obama-era Republicans could routinely get. Map 2 compares Raffensperger’s showing to Romney’s from a decade earlier. Map 2 also includes Sen. Raphael Warnock’s (D-GA) result in Fayette County from his 2022 runoff. Warnock took 49.5% there, which was still a loss, but it was an improvement from the 46.4% he took in the 2021 runoff election. On the 2012 map, about one-third (13 of 37) of the precincts are colored the deepest shade of red—in the Senate runoff map, only two are.
Map 2: 2012 & 2022 in Fayette County, GA
Outside of the Atlanta metro, we are also watching a county that is about two hours south of Fayetteville—one of this county’s residents made news last week for a historic milestone. Jimmy Carter’s home of Plains is located in Sumter County, GA. Though it has less than half the population, it has voted roughly in line with Wilson County, NC: both counties have strong Democratic heritage but, with their rural character, have become more marginal over the longer term.
A few decades ago, Republicans could usually only carry Sumter County in landslides: in both his runs, George W. Bush carried it by a single point as he easily won the state. While Biden’s 5-point margin there was an improvement over Clinton’s showing, Warnock was the only statewide Democrat who carried it in 2022 (he did so in both the general election and runoff). If Trump flips Georgia back this year, it would not be hard to envision his gains coming disproportionately from these types of rural counties.
Assuming Georgia remains highly competitive, we’d expect Fayette County to move towards Harris and Sumter County towards Trump, while a “maximum realignment” scenario could involve both counties changing sides.
We would also note generally that, while none of our selected counties came from the impacted regions in either state, Hurricane Helene’s aftermath may add an extra layer of uncertainty in parts of both Georgia and North Carolina.
Arizona
As we move out to our western Toss-up states, we have to become less choosy, and more inventive, with the counties that we flag—we are moving from Georgia, which has the most counties of our Toss-up states (159) to Arizona, which has the fewest (15). It would not be that much of a stretch to call Arizona and Nevada “city states.” But, in the case of Arizona, while Phoenix’s Maricopa County may arguably be the single most important county in the nation, there could be informative signs elsewhere in the state.
Setting aside Maricopa—as we said in the initial installment of this series, we don’t want to look only at largest counties in each state—we’d flag three counties: Pima, Yavapai, and Mohave. Taken together, they accounted for nearly a quarter of the state’s vote in 2020.
Pima County, which includes Tucson, is the state’s second-largest county and has swung Democratic in every presidential election since 2004. Biden carried it by 19 points. Yavapai and Mohave are, respectively, Arizona’s fourth and fifth-largest counties. Yavapai County is north of Phoenix and has given Republicans consistent 30-point margins since 2008. Mohave County, which has seen an influx of conservative retirees in recent years, became the state’s most Republican county—both in terms of raw votes and percentage margin—in 2020, going to Trump 75%-24%.
As election returns come in from Arizona—as a predominantly mail-in state, its results will trickle in over several days, and we’d be shocked if it were called immediately—we came up with a basic equation to keep in mind: for Democrats to win in Trump-era elections, Pima County has had to cancel out Yavapai and Mohave counties. Table 1 applies this rule to several recent elections (we limited our selection to races that were decided by 4 percentage points or less):
Table 1: The “Pima > Yavapai + Mohave” rule in recent Arizona races
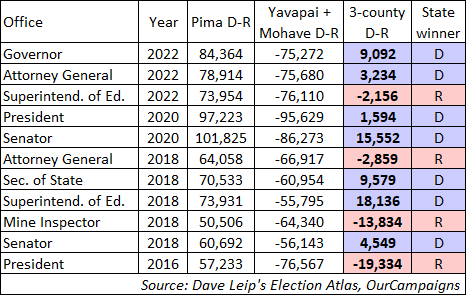
Of course, this is not a large sample size of races and the pattern could hold up until it doesn’t. In fact, had current state Attorney General Kris Mayes (D) gotten just 512 fewer votes out of Pima County, she would have lost her race while carrying the group of three counties (she was elected by 511 votes statewide). But, at least since 2016, we have not been able to find any concrete exceptions to this rule in close statewide races.
When we were initially looking for non-Maricopa counties to isolate in Arizona, Santa Cruz (Nogales) stood out. Situated on the Mexican border, this county of close to 50,000 swung a dozen points to Trump from 2016 to 2020, although Biden still carried it by 35 points. While it was directionally in sync with Hispanics in the rest of the state, it still was an outlier. Drilling a little deeper, Santa Cruz’s Hispanic precincts—which make up most of the county and are 83% Hispanic in aggregate—swung 16 points rightward from 2016 to 2020. Maricopa and Pima counties, combined, have about 160 precincts that are at least 50% Hispanic—these precincts have just over 1 million residents. Biden did slip in these more “urban” Hispanic precincts, but his decline was hardly noticeable, as he carried them by a 44.6 percentage point margin, down from Clinton’s 44.8.
Aside from Santa Cruz County, Yuma County was another non-metro border area where the Hispanic decline was more obvious: Yuma County’s Hispanic precincts, which account for a majority of its 200,000 residents, shifted about 10 points rightward—this was enough to account for the county’s overall swing to Trump, but it was still not as pronounced as the Hispanic shift in the Nogales area.
So, all of this is to say that, perhaps paradoxically, Santa Cruz County probably told us more about the Hispanic vote nationally than about the Hispanic vote throughout the rest of Arizona. According to Catalist’s post-2020 national report, Hispanics overall swung to Trump by a margin comparable to the Hispanic precincts in Santa Cruz County.
Nevada
In Nevada, it is hard to ignore Las Vegas’s Clark County, which makes up close to three-quarters of the state’s population and typically casts nearly 70% of the state’s vote. A decade ago, the conventional wisdom seemed to be that a statewide Democrat would ideally want to carry the county by more than 10 points. Recent cycles, though, have suggested the bar might be a few points lower.
After a close reelection campaign, Catherine Cortez Masto (D) is still a sitting senator after winning Clark County by 7.8%, although now-former Gov. Steve Sisolak’s (D) 5.7% margin was too far into the Democratic “danger zone” (in fairness, he had a strong opponent based there, now-Republican Gov. Joe Lombardo, who previously served as the county’s elected sheriff). In presidential races, Biden’s 9.4% margin in Clark County represented a drop from Clinton’s 10.7% margin, although he was still able to basically match her statewide performance.
So, what’s made the difference? As Clark County has reddened to some degree, Democrats have gained in the Reno area. In 2020, Washoe County—the state’s second-largest county which usually casts close to 20% of its votes—swung 3.3% towards Biden, which was the largest pro-Democratic shift in the state.
Aside from the Clark and Washoe pair, the only remotely competitive locality in the state is Carson City (which is technically considered its own entity). Just south of Washoe County, Obama carried it in 2008 as part of his 13-point rout in Nevada, but it has been less competitive since. From 2016 to 2020, it swung 2.7% towards Biden, so a similar swing this year would get Harris to within single-digits there.
While Democrats are usually in the clear statewide if they carry both Clark and Washoe counties, the pair has not always been enough to guarantee victory: within the last decade, the winning Republicans in the 2022 gubernatorial and 2014 attorney general races lost both large counties. For Harris, at least replicating Cortez Masto’s margins in the large counties—carrying Washoe by about 5% and Clark by 8%—might be a good goal.
To us, the Democratic gains in Washoe County seem to be sticking, so a Trump path to victory in the state would likely be predicated on further Democratic slippage in Clark County.
So with that, we’ll conclude our series here. While our attention will also be on large counties like Maricopa and Clark, we tried to highlight several other lesser-covered counties to keep an eye on.
While we restricted our analysis to just the Toss-up states, there will also be some important benchmark counties in safer states. As Split Ticket’s Armin Thomas mentioned recently, Hamilton County, IN may be a good early indicator of the night. A three-to-one Republican county in the early 2000s, this suburban county north of Indianapolis has seen the same type of trends that Cabarrus, NC and Fayette, GA have. It stuck with Trump in 2020, but his 56%-37% fell to 52%-45%. If Harris flips it, it would be a promising early indicator for her, while if it remains relatively stagnant, the Trump campaign would be happy.
J. Miles Coleman is an elections analyst for Decision Desk HQ and a political cartographer. Follow him on Twitter @jmilescoleman.
See Other Political Commentary by J. Miles Coleman.
See Other Political Commentary.
Views expressed in this column are those of the author, not those of Rasmussen Reports. Comments about this content should be directed to the author or syndicate.
Related Articles

Rasmussen Reports is a media company specializing in the collection, publication and distribution of public opinion information.
We conduct public opinion polls on a variety of topics to inform our audience on events in the news and other topics of interest. To ensure editorial control and independence, we pay for the polls ourselves and generate revenue through the sale of subscriptions, sponsorships, and advertising. Nightly polling on politics, business and lifestyle topics provides the content to update the Rasmussen Reports web site many times each day. If it's in the news, it's in our polls. Additionally, the data drives a daily update newsletter and various media outlets across the country.
Some information, including the Rasmussen Reports daily Presidential Tracking Poll and commentaries are available for free to the general public. Subscriptions are available for $4.95 a month or 34.95 a year that provide subscribers with exclusive access to more than 20 stories per week on upcoming elections, consumer confidence, and issues that affect us all. For those who are really into the numbers, Platinum Members can review demographic crosstabs and a full history of our data.
To learn more about our methodology, click here.