Time for Change Model Predicts Close Election with Slight Edge for Kamala Harris
A Commentary By Alan I. Abramowitz
KEY POINTS FROM THIS ARTICLE
—The Time for Change model suggests that presidential elections are largely determined by three factors: the popularity of the incumbent president, the state of the economy, and the number of terms that the president’s party has controlled the White House.
—Specifically, the “Time for Change” factor of this analysis is based on the post-World War II reality that a party often can win the White House two straight times, but has a harder time holding it for longer than that.
—This year’s version of the model shows Kamala Harris as a narrow favorite in both the popular vote and Electoral College, but her predicted margins are so small that the safest prediction we can make about the 2024 presidential election is that it is likely to be very close.
The Time for Change model
With less than three months remaining until Election Day, and with voting beginning next month in several states, the 2024 presidential race has been transformed by President Joe Biden’s withdrawal from the race and his replacement at the top of the Democratic ticket by Vice President Kamala Harris. Harris’s rapid ascendance and her selection of Minnesota Gov. Tim Walz as her running mate have energized Democratic voters and erased what had been a consistent Republican lead in the polls. Recent national and swing state polls have shown the Harris-Walz ticket running even with or slightly ahead of the Republican ticket of former President Donald Trump and Ohio Sen. JD Vance.
Many things about the 2024 election have been highly unusual, including the withdrawal of the incumbent president under pressure from his own party’s leaders, his replacement by a woman of mixed Black and Indian ancestry, the Republican Party’s nomination of a defeated former president who has been convicted on felony charges, and an attempted assassination attempt against that Republican candidate. Despite these remarkable developments, however, the Time for Change forecasting model should allow us to predict both the popular and the electoral vote with a high degree of accuracy because this election, like all presidential elections, is likely to be decided by a few fundamental forces.
The assumption underlying the Time for Change model, which has an excellent track record in predicting the outcomes of presidential elections since 1992, is that the results of these contests are largely determined by three factors: the popularity of the incumbent president, the state of the economy, and the number of terms that the president’s party has controlled the White House.
Not surprisingly, the more popular the incumbent president and the stronger the economy, the better the candidate of the president’s party tends to do. Less obviously, the incumbent president’s party does better when it has held the White House for a single term than when it has been in power for two terms or longer. That is the “Time for Change” factor, and it has a surprisingly strong relationship with the results of presidential elections. Since World War II, the candidate of the president’s party has won 7 of 9 elections after a single term in office but only 2 of 10 elections after two or more terms in office. The public appears to be more reluctant to vote for a change in direction in Washington after only four years than after eight or more years and in 2024, Democrats will be defending the White House after only four years in office. So even though Harris is not a first-term incumbent running for reelection, she does benefit from something of an incumbency bonus in the model because she is seeking just a second straight term for her party in the White House.
Table 1 presents estimates for the effects of the Time for Change model’s three predictors on the popular vote and the electoral vote based on regression analyses of data from 18 presidential elections between 1948 and 2016.
Data for the 2020 presidential election were excluded from this analysis because of the highly unusual circumstances of an election in the midst of the global coronavirus pandemic. Due to restrictions on many types of economic activity caused by public health concerns, the U.S. economy experienced a dramatic downturn during the second quarter of 2020 with real GDP declining by more than 30% on an annualized basis, and second-quarter GDP growth is a key factor in this model. However, we would not expect voters to have blamed the Trump administration for that decline as they would have in normal times. As a result, a forecast based on the standard model would have likely produced very unrealistic predictions.
Table 1: Estimates for popular and Electoral College vote prediction models
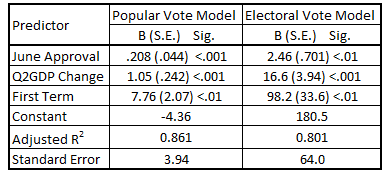
Note: Based on presidential elections from 1948-2016. Data for 2020 election excluded due to out-of-range value for Q2GDP change.
Source: Data compiled by author.
The findings displayed in Table 1 show that each of the three key predictors in the model has a substantial impact on both the popular vote and the electoral vote. Moreover, the model based on these three predictors explains fully 86% of the variance in the popular vote and 80% of the variance in the electoral vote. Even after controlling for the effects of incumbent popularity and economic conditions, the Time for Change factor has very significant effects in both models, giving the incumbent party a predicted boost of almost 8 points of margin in the two-party popular vote margin and nearly 100 electoral votes.
Table 2: Predicted and actual popular vote margins and electoral votes for candidate of incumbent party, 1948-2016
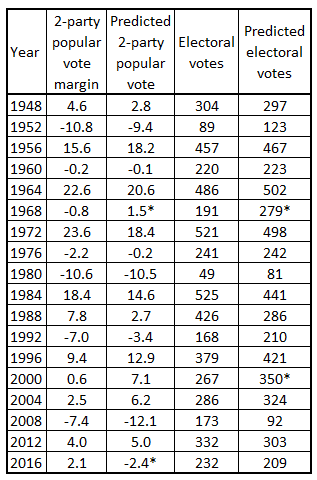
Notes: No prediction for 2020 election due to out-of-range value for Q2GDP change; * denotes an incorrect predicted winner. Popular vote margin is for two-party vote. A smattering of faithless electors over the years are counted as being cast for the candidate who won the state.
Table 2 compares the predictions generated by the Time for Change model for the popular and electoral vote with the actual results of 18 presidential elections between 1948 and 2016. Based on information available in early August, more than three months before Election Day, the model predicts the correct winner of the popular vote in 16 of these elections with an average absolute error of 3.0 percentage points. The model also correctly predicts the correct winner of the Electoral College in 16 of these elections with an average absolute error of 43 electoral votes.
The 2024 forecast
Plugging in President Biden’s net approval rating of -18% in late June and the estimated second quarter growth rate of 2.8% in real GDP along with the fact that Kamala Harris will be defending the White House after a single Democratic term in office, the Time for Change model predicts narrow Democratic victories in both the popular vote and the Electoral College. The predictions are a Democratic margin of 2.6 percentage points in the national popular vote and 281 electoral votes, only 11 more than the minimum of 270 needed to win an Electoral College majority.
Based on these results, clearly the safest prediction that we can make about the 2024 presidential election is that it is likely to be very close. Both the predicted popular vote margin of 2.6 percentage points and the predicted electoral vote margin of 24 votes are much smaller than the standard errors of the two regression equations. Adding to the uncertainty of the predictions are the highly unusual circumstances of the 2024 election, especially the replacement of the incumbent president at the top of the Democratic ticket by the incumbent vice president. These results are based on the assumption that Kamala Harris will enjoy the normal advantage that goes to the candidate seeking just a second-straight party term in the White House (typically this person is an incumbent who was elected to the party’s first term in the previous election, but Harris is not).
It certainly would not be shocking if Donald Trump were to win either the popular vote or the electoral vote in the 2024 presidential election. It would also not be shocking if the outcome turns out to be an Electoral College misfire, a split between the popular vote winner and the electoral vote winner. That has happened twice since 2000 and it almost happened again in 2020. Nevertheless, both the popular vote and the electoral vote models give a small advantage in the 2024 presidential election to the Democratic ticket of Kamala Harris and Tim Walz over the Republican ticket of Donald Trump and JD Vance.
Alan I. Abramowitz is the Alben W. Barkley Professor Emeritus of Political Science at Emory University and a senior columnist with Sabato’s Crystal Ball. His latest book, The Great Alignment: Race, Party Transformation, and the Rise of Donald Trump, was released in 2018 by Yale University Press.
See Other Commentary by Dr. Alan Abramowitz.
See Other Political Commentary.
Views expressed in this column are those of the author, not those of Rasmussen Reports. Comments about this content should be directed to the author or syndicate.
Related Articles

Rasmussen Reports is a media company specializing in the collection, publication and distribution of public opinion information.
We conduct public opinion polls on a variety of topics to inform our audience on events in the news and other topics of interest. To ensure editorial control and independence, we pay for the polls ourselves and generate revenue through the sale of subscriptions, sponsorships, and advertising. Nightly polling on politics, business and lifestyle topics provides the content to update the Rasmussen Reports web site many times each day. If it's in the news, it's in our polls. Additionally, the data drives a daily update newsletter and various media outlets across the country.
Some information, including the Rasmussen Reports daily Presidential Tracking Poll and commentaries are available for free to the general public. Subscriptions are available for $4.95 a month or 34.95 a year that provide subscribers with exclusive access to more than 20 stories per week on upcoming elections, consumer confidence, and issues that affect us all. For those who are really into the numbers, Platinum Members can review demographic crosstabs and a full history of our data.
To learn more about our methodology, click here.