If it's in the News, it's in our Polls. Public opinion polling since 2003.

Archive

Most Recent Releases

January 26, 2015

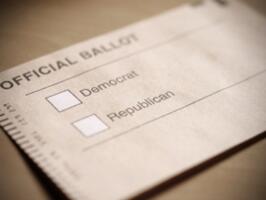
Generic Congressional Ballot: Democrats 40%, Republicans 37%

Democrats have a three-point lead over Republicans on the latest Generic Congressional Ballot. 

A new Rasmussen Reports national telephone survey for the week ending January 25 finds that 40% of Likely U.S. Voters would vote for the Democratic candidate in their district's congressional race if the election were held today, while 37% would choose the Republican instead. 

(Want a free daily e-mail update? If it's in the news, it's in our polls). Rasmussen Reports updates are also available on Twitter or Facebook

The national telephone survey of 2,800 Likely Voters was conducted by Rasmussen Reports from January 19-25, 2015. The margin of sampling error for the survey is +/- 2 percentage points with a 95% level of confidence. Field work for all Rasmussen Reports surveys is conducted by Pulse Opinion Research, LLC. See methodology

January 26, 2015

War on Terror Confidence Falls Even Further

Belief that the United States is winning the War on Terror has fallen to yet another low, with over half of voters still convinced that America’s leaders are too eager to use the nation’s military forces.

A new Rasmussen Reports national telephone survey finds that only 23% of Likely U.S. Voters now believe the United States and its allies are winning the War on Terror, the lowest finding in nearly 11 years of regular tracking.That’s down from 25% in October and 39% a year ago at this time.

(Want a free daily e-mail update? If it's in the news, it's in our polls).  Rasmussen Reports updates are also available on Twitter or Facebook.

The survey of 800 Likely Voters was conducted on January 23-24, 2015 by Rasmussen Reports. The margin of sampling error is +/- 3 percentage points with a 95% level of confidence. Field work for all Rasmussen Reports surveys is conducted by Pulse Opinion Research, LLC. See methodology.

January 24, 2015

What They Told Us: Reviewing Last Week’s Key Polls - Week Ending January 24, 2015

Maybe it’s just the improving economy, but voters are less critical of the job President Obama is doing and even appear receptive to some of the new government programs he’s proposing. That doesn’t necessarily mean they want to pay for them, though.

January 22, 2015

Is It the Government's Job to Close the Income Gap?

President Obama focused much of his State of the Union address this week on initiatives he says will financially help lower- and middle-income Americans, but voters still place more importance on government policies that encourage a free market over ones that reduce the income gap.

A new Rasmussen Reports national telephone survey finds that 66% of Likely U.S. Voters consider policies that reduce the income gap between rich and poor to be at least somewhat important. Twenty-eight percent (28%) don’t consider such policies to be important. This includes 38% who regard those policies as Very Important and eight percent (8%) who say they are Not At All Important. (To see survey question wording, click here.)

(Want a free daily e-mail update? If it's in the news, it's in our polls). Rasmussen Reports updates are also available on Twitter or Facebook.

The survey of 800 Likely Voters was conducted on January 19-20, 2015 by Rasmussen Reports. The margin of sampling error is +/- 3.5 percentage points with a 95% level of confidence. Field work for all Rasmussen Reports surveys is conducted by Pulse Opinion Research, LLC. See methodology.

January 21, 2015

30% Say U.S. Heading in Right Direction

Thirty percent (30%) of Likely U.S. Voters think the country is heading in the right direction, according to a new Rasmussen Reports national telephone survey for the week ending January 18. 

This finding is unchanged from the week before. The number of voters who think the country is heading in the right direction was below 30% most weeks last year.

(Want a free daily e-mail update? If it's in the news, it's in our polls). Rasmussen Reports updates are also available on Twitter or Facebook.
       
 The national telephone survey of 2,800 Likely Voters was conducted by Rasmussen Reports from January 12-18, 2015. The margin of sampling error for the survey is +/- 2 percentage points with a 95% level of confidence. Field work for all Rasmussen Reports surveys is conducted by Pulse Opinion Research, LLC. See methodology.

January 19, 2015

Generic Congressional Ballot: Democrats 39%, Republicans 38%

Democrats have a one-point lead over Republicans on the latest Generic Congressional Ballot.

A new Rasmussen Reports national telephone survey for the week ending January 18 finds that 39% of Likely U.S. Voters would vote for the Democratic candidate in their district's congressional race if the election were held today, while 38% would choose the Republican instead.

(Want a free daily e-mail update? If it's in the news, it's in our polls). Rasmussen Reports updates are also available on Twitter or Facebook.

The national telephone survey of 2,800 Likely Voters was conducted by Rasmussen Reports from December 29-30, 2014 and January 2-4, 2015. The margin of sampling error for the survey is +/- 2 percentage points with a 95% level of confidence. Field work for all Rasmussen Reports surveys is conducted by Pulse Opinion Research, LLC. See methodology.

January 19, 2015

Voters Complain More About Health Care And Aren’t Optimistic

Voters are more critical of the health care they personally receive but still don’t expect it to get better under Obamacare. Most think consumers are better off with less government involvement in the health care marketplace.

The latest Rasmussen Reports national telephone survey finds that just 33% of Likely U.S. Voters rate the U.S. health care system in general as good or excellent. Twenty-eight percent (28%) regard the system as poor. This is consistent with voter attitudes since mid-2013. (To see survey question wording, click here.)

(Want a free daily e-mail update? If it's in the news, it's in our polls). Rasmussen Reports updates are also available on Twitter or Facebook

The survey of 1,000 Likely Voters was conducted on January 3-4, 2015 by Rasmussen Reports. The margin of sampling error is +/- 3 percentage points with a 95% level of confidence. Field work for all Rasmussen Reports surveys is conducted by Pulse Opinion Research, LLC. See methodology.

January 18, 2015

Fewer Voters Think Allies Should Follow America's Lead

Voters continue to show little optimism about America’s future and feel less strongly about this nation's leadership role.

Thirty-two percent (32%) of Likely U.S. Voters now think America’s best days are in the future, according to a new Rasmussen Reports national telephone survey. That’s down from 34% in October but still above the all-time low of 29% last July. Forty-six percent (46%) think America’s best days are already in the past, but that’s down from 51% in the previous survey and is the lowest finding in a year. Another 22% are undecided. (To see survey question wording, click here.)

(Want a free daily e-mail update? If it's in the news, it's in our polls). Rasmussen Reports updates are also available on Twitter or Facebook.

The national telephone survey of 800 Likely Voters was conducted by Rasmussen Reports on January 13-14, 2015. The margin of sampling error for the survey is +/- 3.5 percentage points with a 95% level of confidence. Fieldwork for all Rasmussen Reports surveys is conducted by Pulse Opinion Research, LLC. See methodology.

January 17, 2015

What They Told Us: Reviewing Last Week’s Key Polls: Week Ending January 17, 2015

Bob Dylan once declared, “Something is happening here, but you don’t know what it is.” That could well describe America’s response to radical Islam.

January 12, 2015

Generic Congressional Ballot: Democrats 38%, Republicans 38%

Republicans and Democrats are tied on the Generic Congressional Ballot for the second time in three weeks.

A new Rasmussen Reports national telephone survey for the week ending January 11 finds that 38% of Likely U.S. Voters would vote for the Democratic candidate in their district's congressional race if the election were held today, while 38% would choose the Republican instead.

(Want a free daily e-mail update? If it's in the news, it's in our polls). Rasmussen Reports updates are also available on Twitter or Facebook.

The national telephone survey of 2,800 Likely Voters was conducted by Rasmussen Reports from December 29-30, 2014 and January 2-4, 2015. The margin of sampling error for the survey is +/- 2 percentage points with a 95% level of confidence. Field work for all Rasmussen Reports surveys is conducted by Pulse Opinion Research, LLC. See methodology.

January 12, 2015

Voters Think Pathway to Citizenship Will Lead to More Illegal Immigration

Voters continue to believe that securing the border is more important than legalizing the status of undocumented workers already here and think plans to offer legal status to such individuals will just encourage more illegal immigration.

January 10, 2015

What They Told Us: Reviewing Last Week’s Key Polls - Week Ending January 10, 2015

Obama vs. Congress – Round One. Voters are strongly hoping the country comes out the winner.

January 9, 2015

Voters Doubt More Money Will Make Better Students

Very few voters know how much the United States spends on students each year, but they do know the money being spent isn’t doing much good.

A new Rasmussen Reports national telephone survey finds that just eight percent (8%) of Likely U.S. Voters know that the United States spends an average of $11,000 per student per year. This is down slightly from September and tied with last January’s low. Forty-four percent (44%) think the country spends less, including 11% who think America spends as little as $3,000 per student. Seven percent (7%) think it spends an average of $13,000 per year. Forty-two percent (42%) are not sure, the highest level of doubt to date. (To see survey question wording, click here.)

(Want a free daily e-mail update? If it's in the news, it's in our polls). Rasmussen Reports updates are also available on Twitter or Facebook.

The survey of 800 Likely U.S. Voters was conducted on January 7-8, 2015 by Rasmussen Reports. The margin of sampling error is +/- 3.5 percentage points with a 95% level of confidence. Field work for all Rasmussen Reports surveys is conducted by Pulse Opinion Research, LLC. See methodology.

January 6, 2015

Rasmussen Employment Index Closes 2014 On Another High

The Rasmussen Employment Index which measures worker confidence continues to climb, hitting a six-year high for the second month in a row in December.

At 104.2, worker confidence is up two points from the previous high of 102.4 in November. The index fell to a recent low of 81.2 in October 2013 but gained steadily after that. After the Wall Street meltdown in the fall of 2008, the index fell dramatically, hitting an all-time low of 57.8 in July 2009.

(Want a free daily e-mail update? If it's in the news, it's in our polls). Rasmussen Reports updates are also available on Twitter or Facebook.

The survey of 9,369 working Americans was conducted in December 2014 by Rasmussen Reports. The margin of sampling error is +/- 1 percentage points with a 95% level of confidence. Field work for all Rasmussen Reports surveys is conducted by Pulse Opinion Research, LLC. See methodology.

January 5, 2015

Generic Congressional Ballot: Democrats 40%, Republicans 38%

Democrats and Republicans are closing out 2014 tied on the Generic Congressional Ballot.

A new Rasmussen Reports national telephone survey for the week ending December 28 finds that 39% of Likely U.S. Voters would vote for the Republican candidate in their district's congressional race if the election were held today, while the same number (39%) would choose the Democrat instead.

(Want a free daily e-mail update? If it's in the news, it's in our polls). Rasmussen Reports updates are also available on Twitter or Facebook.

The national telephone survey of 2,800 Likely Voters was conducted by Rasmussen Reports from December 29-30, 2014 and January 2-4, 2015. The margin of sampling error for the survey is +/- 2 percentage points with a 95% level of confidence. Field work for all Rasmussen Reports surveys is conducted by Pulse Opinion Research, LLC. See methodology.

January 5, 2015

Voters View Obamacare More Favorably

Voters are nearly tied in their opinions of the new national health care law, Obamacare’s best showing since just before its official rollout in November 2013. But voters still expect the quality of health care to suffer and costs to go up as a result of the law.

The latest Rasmussen Reports national telephone survey finds that 46% of Likely U.S. Voters now have a favorable opinion of the law, while 49% view it unfavorably. This includes 18% with a Very Favorable view and 34% with a Very Unfavorable one. (To see survey question wording, click here.)

(Want a free daily e-mail update? If it's in the news, it's in our polls). Rasmussen Reports updates are also available on Twitter or Facebook

The survey of 1,000 Likely Voters was conducted on January 3-4, 2015 by Rasmussen Reports. The margin of sampling error is +/- 3 percentage points with a 95% level of confidence. Field work for all Rasmussen Reports surveys is conducted by Pulse Opinion Research, LLC. See methodology.

January 2, 2015

Obama's Job Approval Up A Point in December

When tracking President Obama’s job approval on a daily basis, people sometimes get so caught up in the day-to-day fluctuations that they miss the bigger picture. To look at the longer-term trends, Rasmussen Reports compiles the numbers on a full-month basis, and the results can be seen in the graphics below.  

The president ended the year with a monthly job approval in December of 48%. That’s up a point from the previous three months but is one point shy of his high for the year of 49% in February and May. Obama’s monthly overall approval hit a two-year low of 45% in November 2013 during the troubled rollout of the new national health care law.

(Want a free daily e-mail update? If it's in the news, it's in our polls). Rasmussen Reports updates are also available on Twitter or Facebook.

Daily tracking results are collected via telephone surveys of 500 likely voters per night. The monthly numbers in this article are based on approximately 15,000 interviews each month with likely voters. The margin of sampling error is less than +/- 1 percentage points with a 95% level of confidence.

December 31, 2014

30% Say U.S. Heading in Right Direction

Thirty percent (30%) of Likely U.S. Voters think the country is heading in the right direction, according to a new Rasmussen Reports national telephone survey for the week ending December 28. 

This finding is up three points from the previous week and is the highest finding since early June. The number of voters who think the country is on the right course ranged from 23% to 27% nearly every week after that and has been below 30% most weeks since June of last year.

(Want a free daily e-mail update? If it's in the news, it's in our polls). Rasmussen Reports updates are also available on Twitter or Facebook.
   
 The national telephone survey of 3,500 Likely Voters was conducted by Rasmussen Reports from December 8-14, 2014. The margin of sampling error for the survey is +/- 2 percentage points with a 95% level of confidence. Field work for all Rasmussen Reports surveys is conducted by Pulse Opinion Research, LLC. See methodology.

December 29, 2014

Generic Congressional Ballot: Democrats 39%, Republicans 39%

Democrats and Republicans are closing out 2014 tied on the Generic Congressional Ballot.

A new Rasmussen Reports national telephone survey for the week ending December 28 finds that 39% of Likely U.S. Voters would vote for the Republican candidate in their district's congressional race if the election were held today, while the same number (39%) would choose the Democrat instead.

(Want a free daily e-mail update? If it's in the news, it's in our polls). Rasmussen Reports updates are also available on Twitter or Facebook.

The national telephone survey of 3,500 Likely Voters was conducted by Rasmussen Reports from December 22-23, and December 28, 2014. The margin of sampling error for the survey is +/- 2 percentage points with a 95% level of confidence. Field work for all Rasmussen Reports surveys is conducted by Pulse Opinion Research, LLC. See methodology.